QUESTION IMAGE
Question
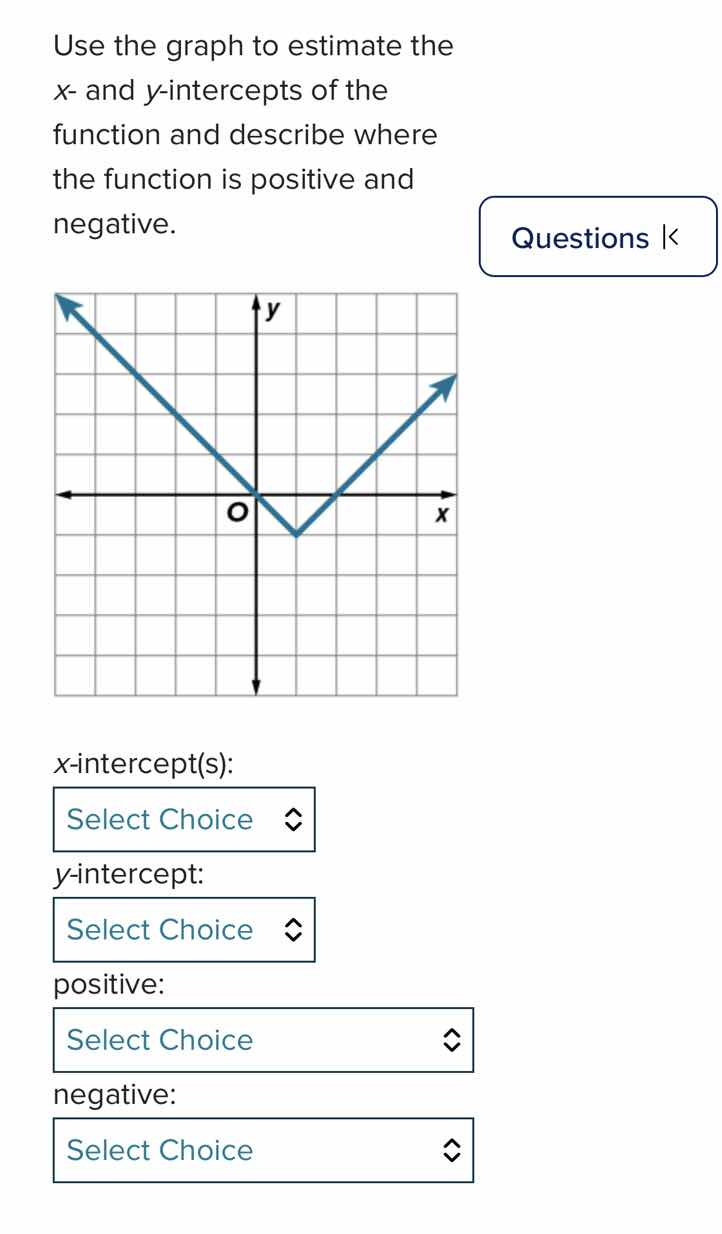
use the graph to estimate the x- and y-intercepts of the function and describe where the function is positive and negative.
x-intercept(s):
select choice
y-intercept:
select choice
positive:
select choice
negative:
select choice
Step1: Identify x - intercepts
The x - intercepts are the points where the graph intersects the x - axis (where \(y = 0\)). From the graph, we can see that the graph intersects the x - axis at \(x = 0\) and at another positive \(x\) - value (let's assume the vertex is at \((1,- 1)\) approximately, and the right - hand side of the V - shaped graph intersects the x - axis at \(x = 2\)? Wait, no, looking at the graph, the left - hand line passes through the origin \((0,0)\) and the right - hand line also passes through the origin? Wait, no, the graph is a V - shape with the vertex below the x - axis. Wait, the left - hand segment goes from the top left, passes through \((0,0)\) and the vertex is at \((1,-1)\) (assuming grid squares are 1 unit). Then the right - hand segment goes from the vertex \((1,-1)\) up to the right. So the x - intercepts are the points where \(y = 0\). The left - hand segment intersects the x - axis at \(x = 0\) and the right - hand segment intersects the x - axis at \(x = 2\)? Wait, no, let's re - examine. The graph passes through the origin \((0,0)\) and then has a vertex, and then the right - hand part intersects the x - axis again? Wait, maybe the x - intercepts are \(x = 0\) and \(x = 2\) (if the vertex is at \((1,-1)\)). Wait, actually, from the graph, the left line goes through \((0,0)\) and the right line, when extended, let's see: the vertex is at \((1,-1)\), so the equation of the right line: slope is \(1\) (since from \((1,-1)\) to \((2,0)\) is a slope of \(1\)). So the right line has equation \(y=(x - 1)-1=x - 2\). Setting \(y = 0\), \(x-2=0\) gives \(x = 2\). And the left line: slope is \(- 1\) (from \((-1,1)\) to \((0,0)\)), equation \(y=-x\). Setting \(y = 0\), \(x = 0\). So x - intercepts are \(x = 0\) and \(x = 2\).
Step2: Identify y - intercept
The y - intercept is the point where the graph intersects the y - axis (where \(x = 0\)). From the graph, when \(x = 0\), \(y = 0\), so the y - intercept is \(y = 0\).
Step3: Determine where the function is positive
A function is positive when \(y>0\). Looking at the graph, the left - hand segment (with slope \(-1\)) is positive when \(x<0\) (since for \(x<0\), \(y=-x>0\) because \(x\) is negative, so \(-x\) is positive). The right - hand segment (with slope \(1\)) is positive when \(x>2\) (since for \(x>2\), \(y=x - 2>0\)).
Step4: Determine where the function is negative
A function is negative when \(y<0\). From the graph, between \(x = 0\) and \(x = 2\) (excluding the endpoints where \(y = 0\)), the function is below the x - axis, so \(y<0\) when \(0

Snap & solve any problem in the app
Get step-by-step solutions on Sovi AI
Photo-based solutions with guided steps
Explore more problems and detailed explanations
x - intercept(s): \(x = 0\) and \(x = 2\) (or in coordinate form \((0,0)\) and \((2,0)\))
y - intercept: \(y = 0\) (or in coordinate form \((0,0)\))
positive: \(x<0\) or \(x>2\)
negative: \(0