QUESTION IMAGE
Question
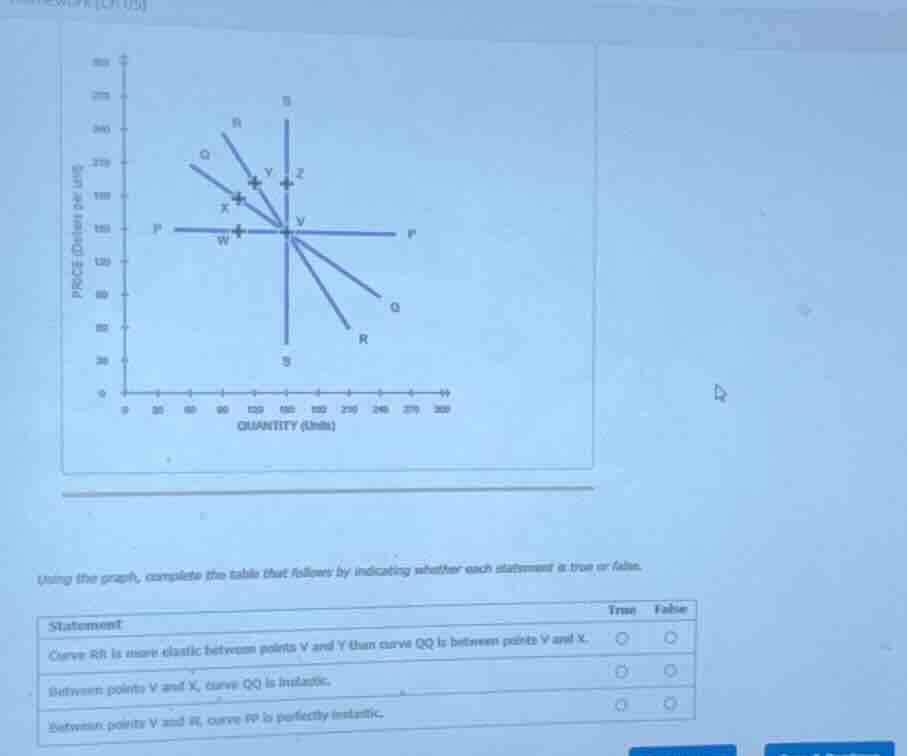
using the graph, complete the table that follows by indicating whether each statement is true or false.
statement\ttrue\tfalse
curve rr is more elastic between points v and y than curve qq is between points v and x.\t○\t○
between points v and x, curve qq is inelastic.\t○\t○
between points v and w, curve pp is perfectly inelastic.\t○\t○
Brief Explanations
- For curve RR vs QQ: Along a linear demand curve, elasticity falls as we move down. Curve RR is steeper and lies below QQ; between V-Y (lower price range) for RR, demand is less elastic than QQ in V-X (higher price range). So this statement is false.
- Curve QQ (V to X): This segment is on the upper half of a linear demand curve, where demand is elastic (not inelastic). So this statement is false.
- Curve PP: It is a horizontal line, which represents perfectly elastic demand, not perfectly inelastic. Perfectly inelastic is a vertical line. So this statement is false.

Snap & solve any problem in the app
Get step-by-step solutions on Sovi AI
Photo-based solutions with guided steps
Explore more problems and detailed explanations
| Statement | True | False |
|---|---|---|
| Between points V and X, curve QQ is inelastic. | ○ | ● |
| Between points V and W, curve PP is perfectly inelastic. | ○ | ● |