QUESTION IMAGE
Question
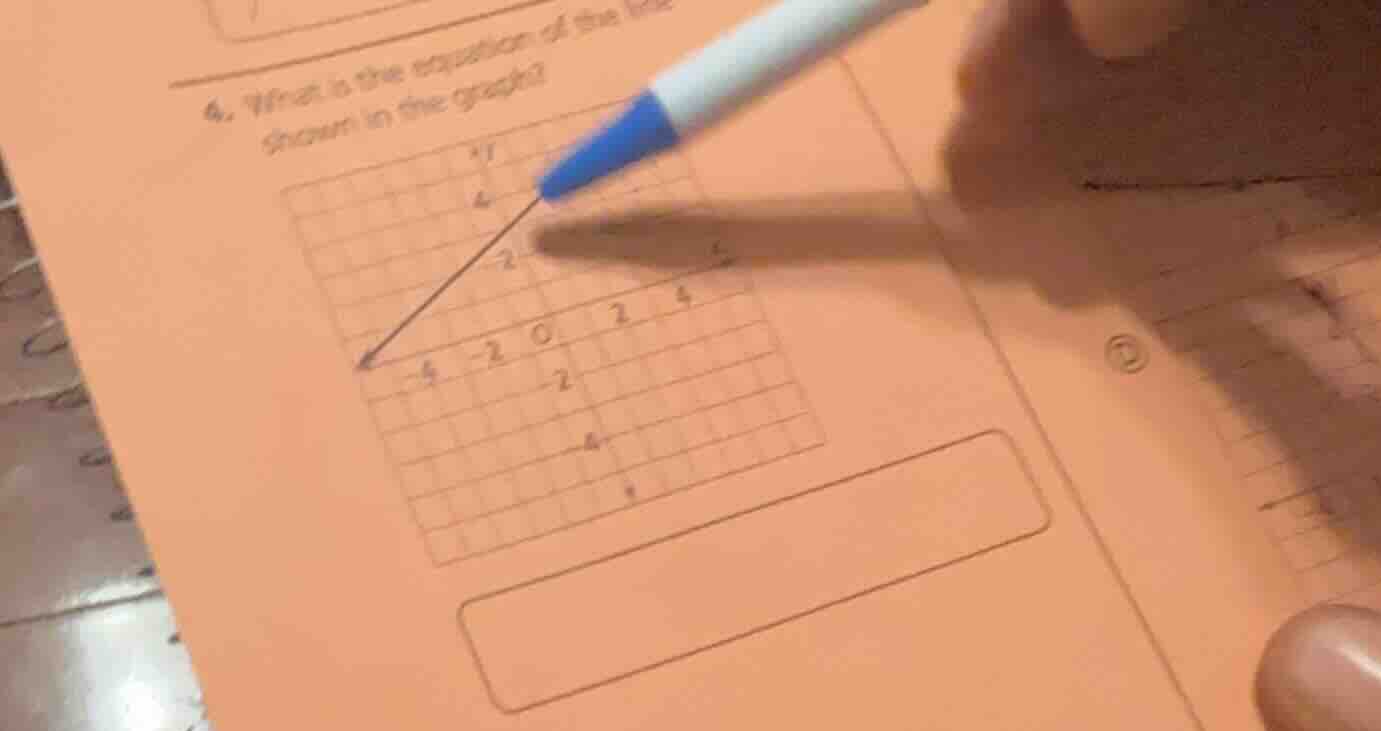
- what is the equation of the line shown in the graph?
Step1: Identify two points on the line
From the graph, we can see that the line passes through \((-6, 0)\) and \((0, 4)\).
Step2: Calculate the slope (\(m\))
The slope formula is \(m=\frac{y_2 - y_1}{x_2 - x_1}\). Using the points \((-6, 0)\) and \((0, 4)\), we have \(m=\frac{4 - 0}{0 - (-6)}=\frac{4}{6}=\frac{2}{3}\).
Step3: Determine the y - intercept (\(b\))
The y - intercept is the value of \(y\) when \(x = 0\). From the point \((0, 4)\), we know that \(b = 4\).
Step4: Write the equation of the line
The slope - intercept form of a line is \(y=mx + b\). Substituting \(m=\frac{2}{3}\) and \(b = 4\) into the formula, we get \(y=\frac{2}{3}x+4\).

Snap & solve any problem in the app
Get step-by-step solutions on Sovi AI
Photo-based solutions with guided steps
Explore more problems and detailed explanations
The equation of the line is \(y = \frac{2}{3}x+4\)