QUESTION IMAGE
Question
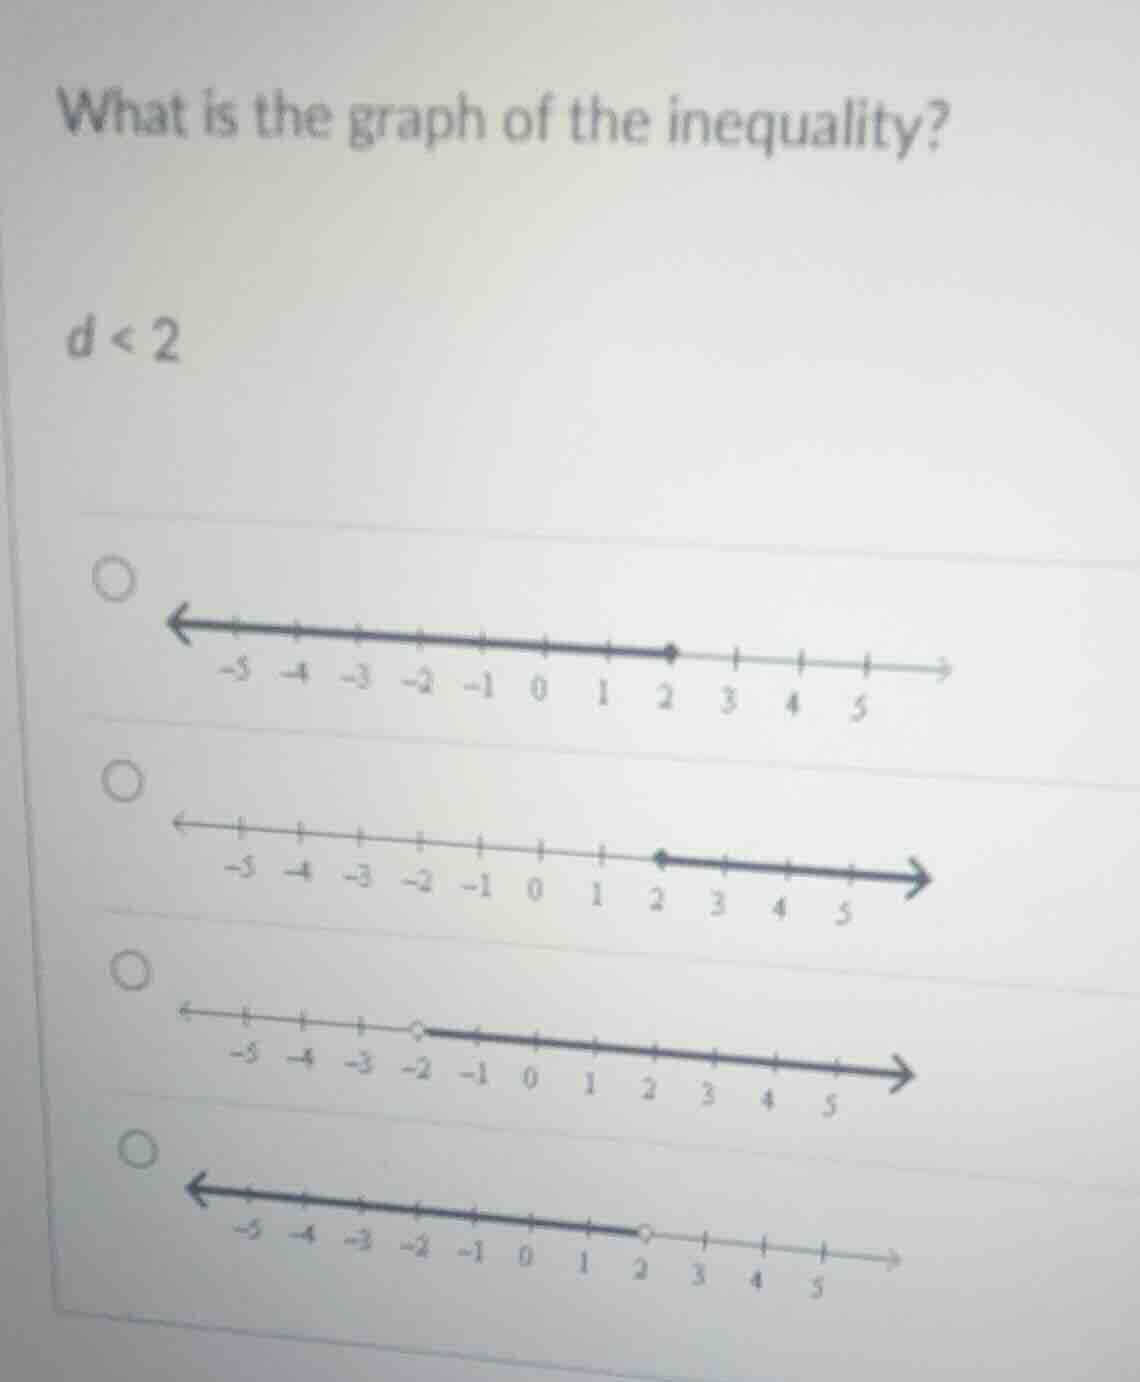
what is the graph of the inequality?
d < 2
Step1: Identify inequality type
The inequality is $d < 2$, which means $d$ is all values less than 2, not including 2 itself.
Step2: Match to number line rules
For $<$ (not equal to), we use an open circle at 2. We shade all values to the left of 2 (since those are the numbers smaller than 2).

Snap & solve any problem in the app
Get step-by-step solutions on Sovi AI
Photo-based solutions with guided steps
Explore more problems and detailed explanations
The fourth option: A number line with an open circle at 2, and a shaded arrow pointing left from 2 towards negative infinity.