QUESTION IMAGE
Question
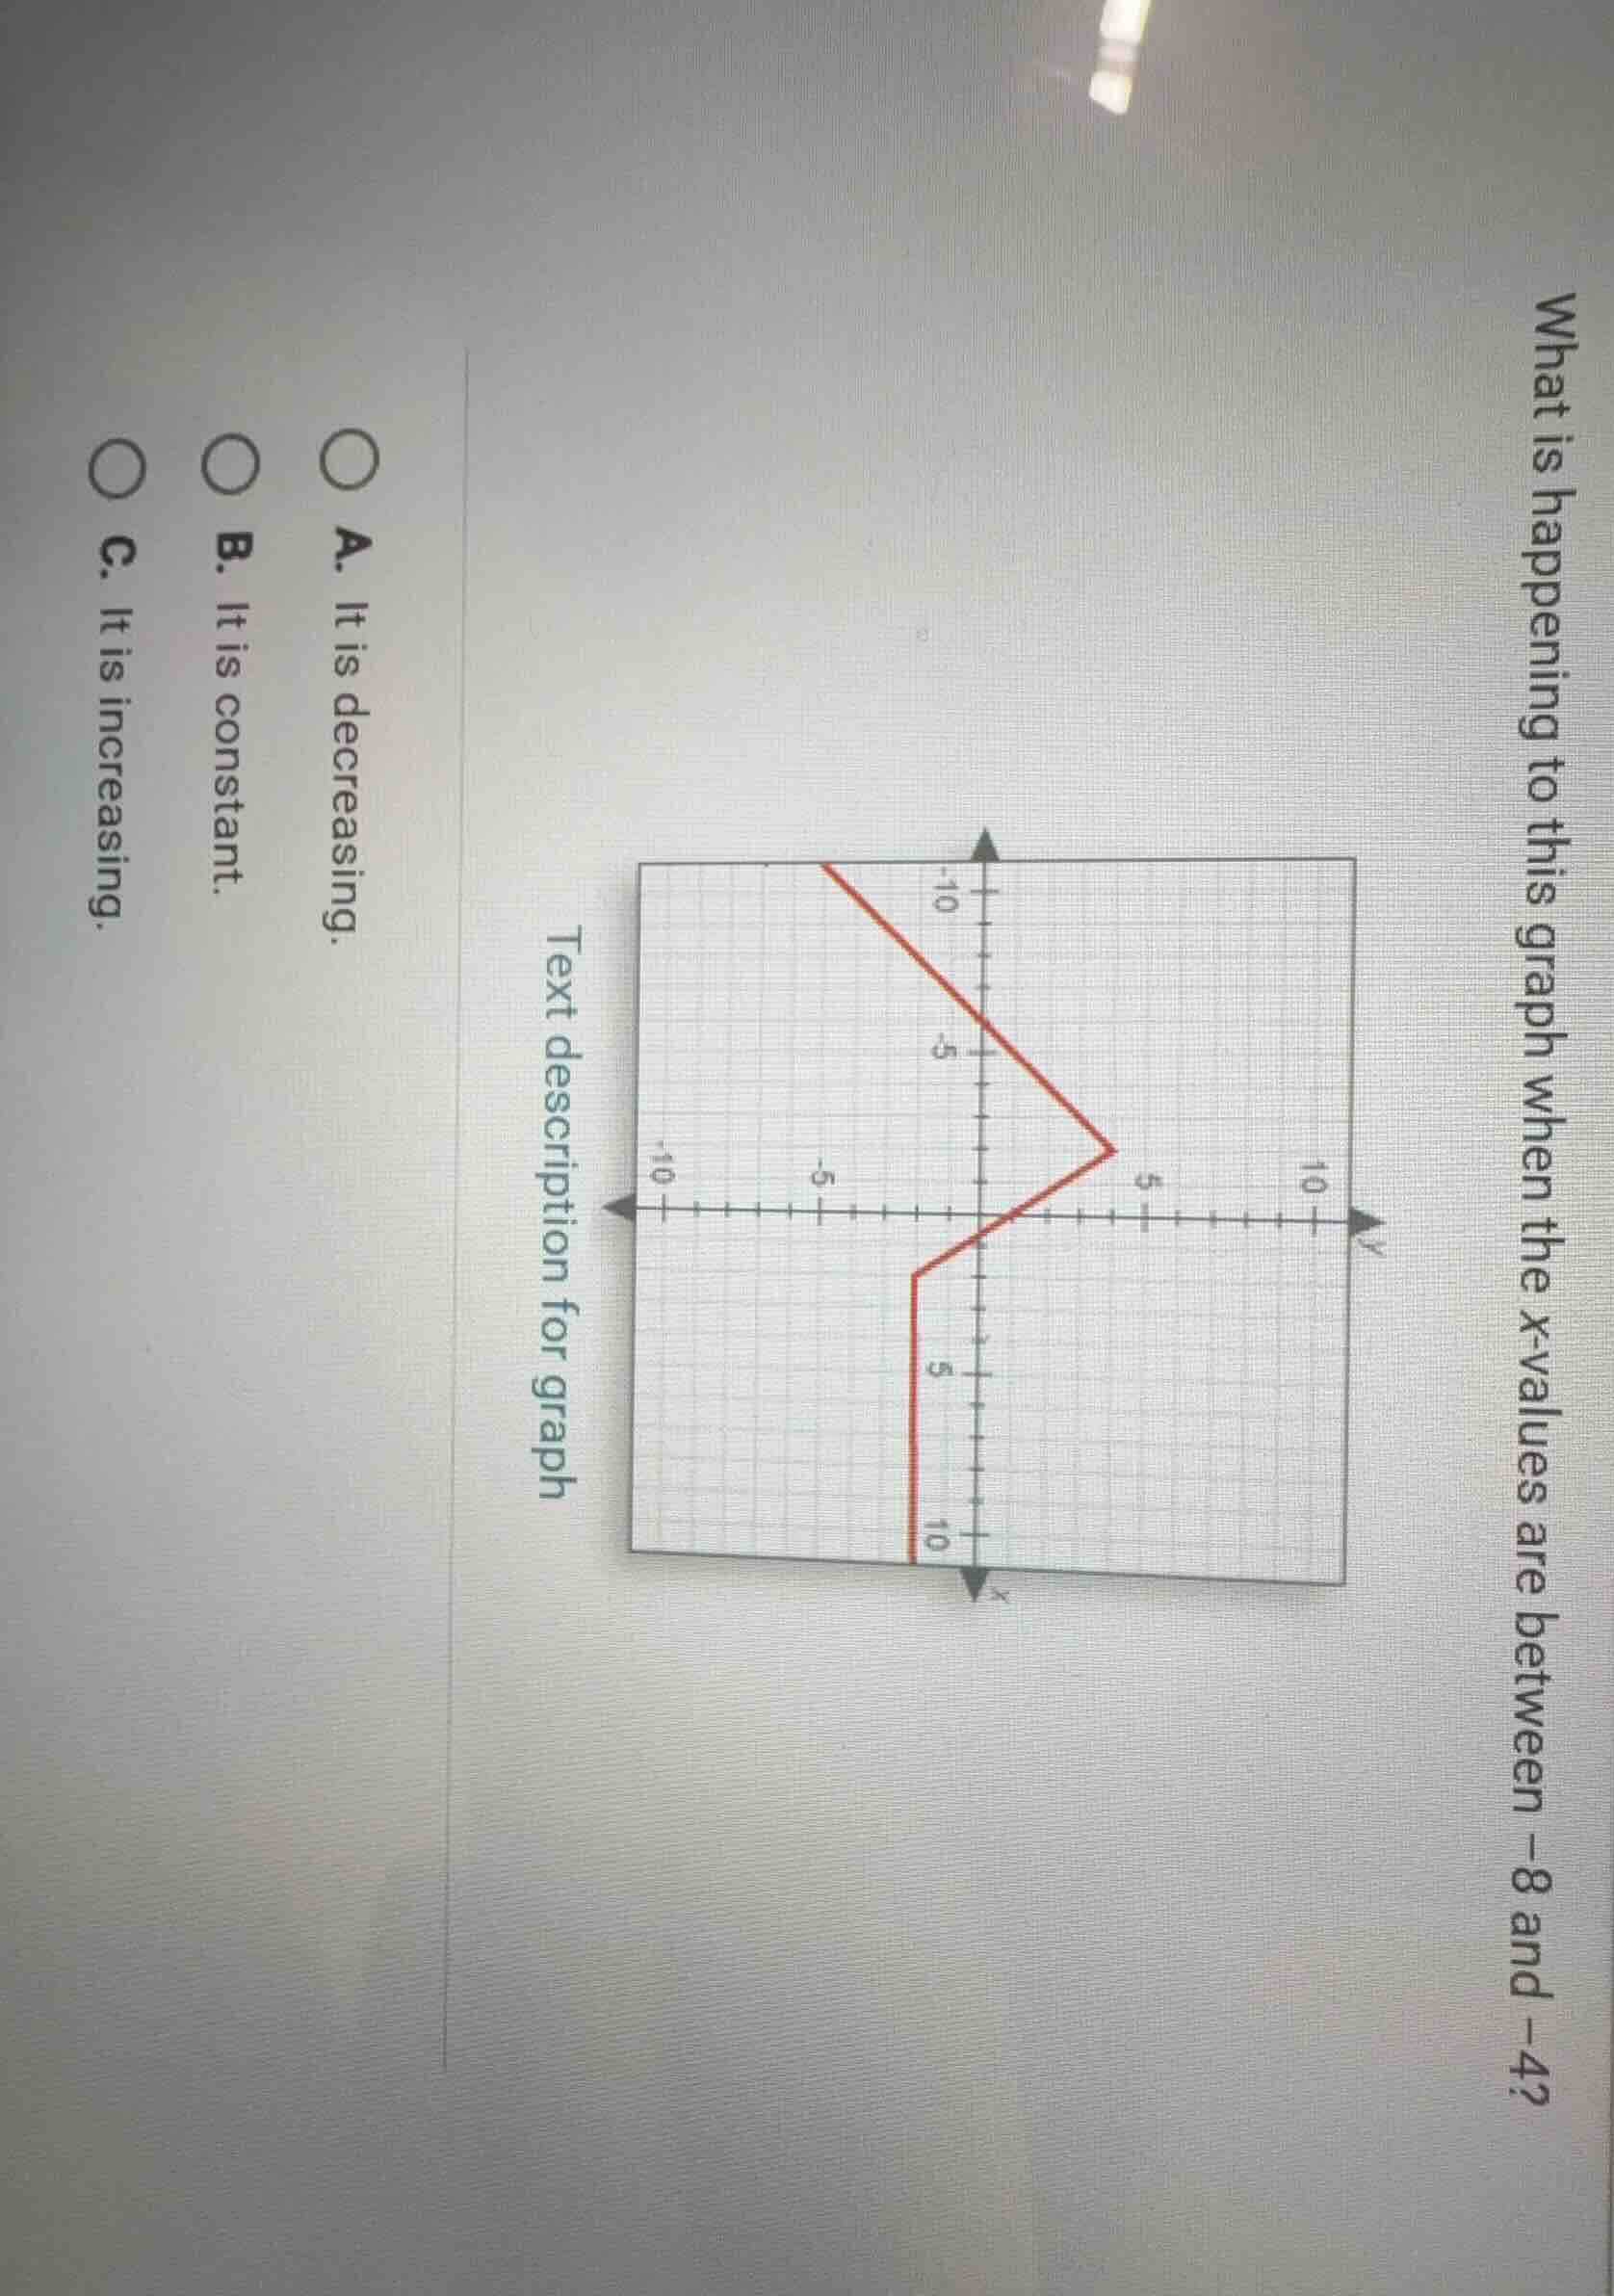
what is happening to this graph when the x-values are between -8 and -4?a. it is decreasing.b. it is constant.c. it is increasing.text description for graph
Brief Explanations
When x-values are between -8 and -4, observe the graph: as x increases (moves right along the x-axis), the y-values of the line fall (move down along the y-axis). This means the function's value decreases as x increases in this interval.

Snap & solve any problem in the app
Get step-by-step solutions on Sovi AI
Photo-based solutions with guided steps
Explore more problems and detailed explanations
A. It is decreasing.