QUESTION IMAGE
Question
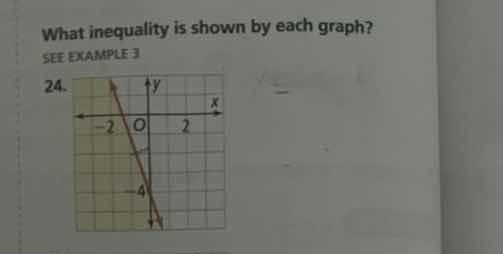
what inequality is shown by each graph?
see example 3
24.
Step1: Find line equation
First, identify two points on the line: $(-2, 0)$ and $(0, -4)$. Calculate the slope:
$m = \frac{-4 - 0}{0 - (-2)} = \frac{-4}{2} = -2$
The y-intercept $b = -4$, so the line equation is $y = -2x - 4$.
Step2: Determine inequality type
The line is solid, so the inequality uses $\leq$ or $\geq$. The shaded region is above the line, so we test a point in the shaded area (e.g., $(0,0)$):
$0 \geq -2(0) - 4$ → $0 \geq -4$, which is true.

Snap & solve any problem in the app
Get step-by-step solutions on Sovi AI
Photo-based solutions with guided steps
Explore more problems and detailed explanations
$y \geq -2x - 4$