QUESTION IMAGE
Question
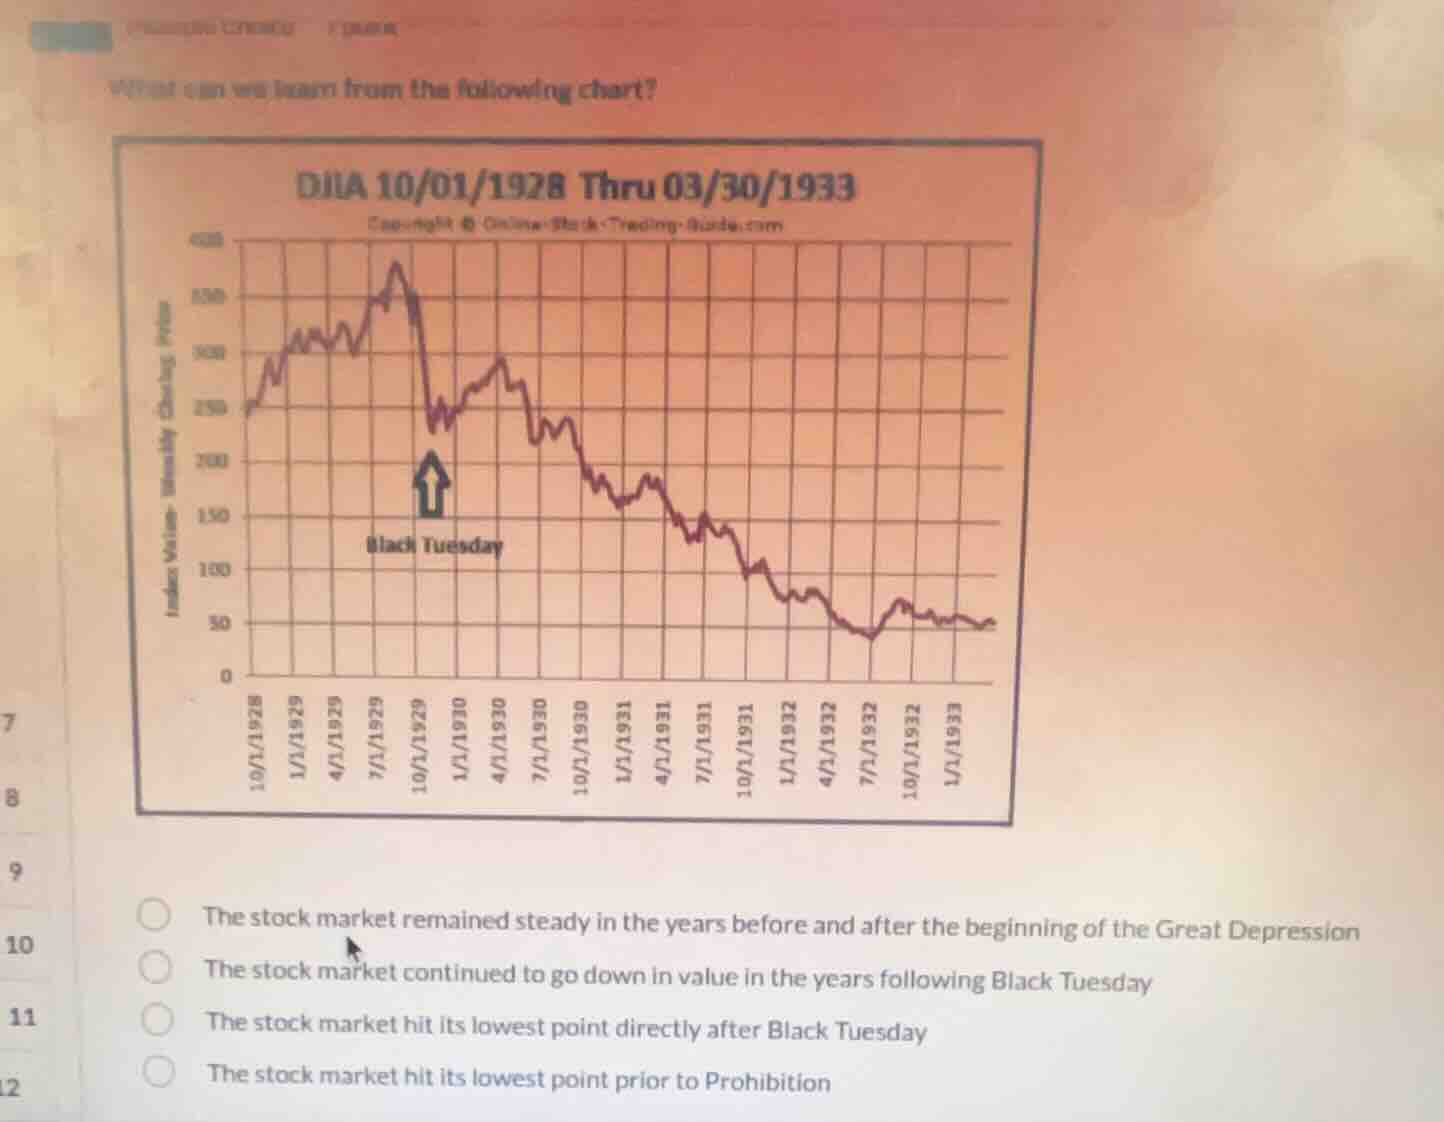
what can we learn from the following chart?
the stock market remained steady in the years before and after the beginning of the great depression
the stock market continued to go down in value in the years following black tuesday
the stock market hit its lowest point directly after black tuesday
the stock market hit its lowest point prior to prohibition
Brief Explanations
- Analyze each option:
- Option 1: The chart shows significant fluctuations (rise then fall after Black Tuesday), so the market was not steady. Eliminate.
- Option 2: After Black Tuesday (marked on the chart), the index value generally trends downward over the years (from ~250+ to ~50). This matches the chart's trend.
- Option 3: The chart shows the market had a recovery (upward movement) right after Black Tuesday before continuing to fall. So it did not hit the lowest point directly after. Eliminate.
- Option 4: Prohibition was in the 1920s (ended 1933), but the chart's lowest point is around 1932 - 1933, after Prohibition's end. Also, the lowest point is not prior to Prohibition. Eliminate.

Snap & solve any problem in the app
Get step-by-step solutions on Sovi AI
Photo-based solutions with guided steps
Explore more problems and detailed explanations
B. The stock market continued to go down in value in the years following Black Tuesday