QUESTION IMAGE
Question
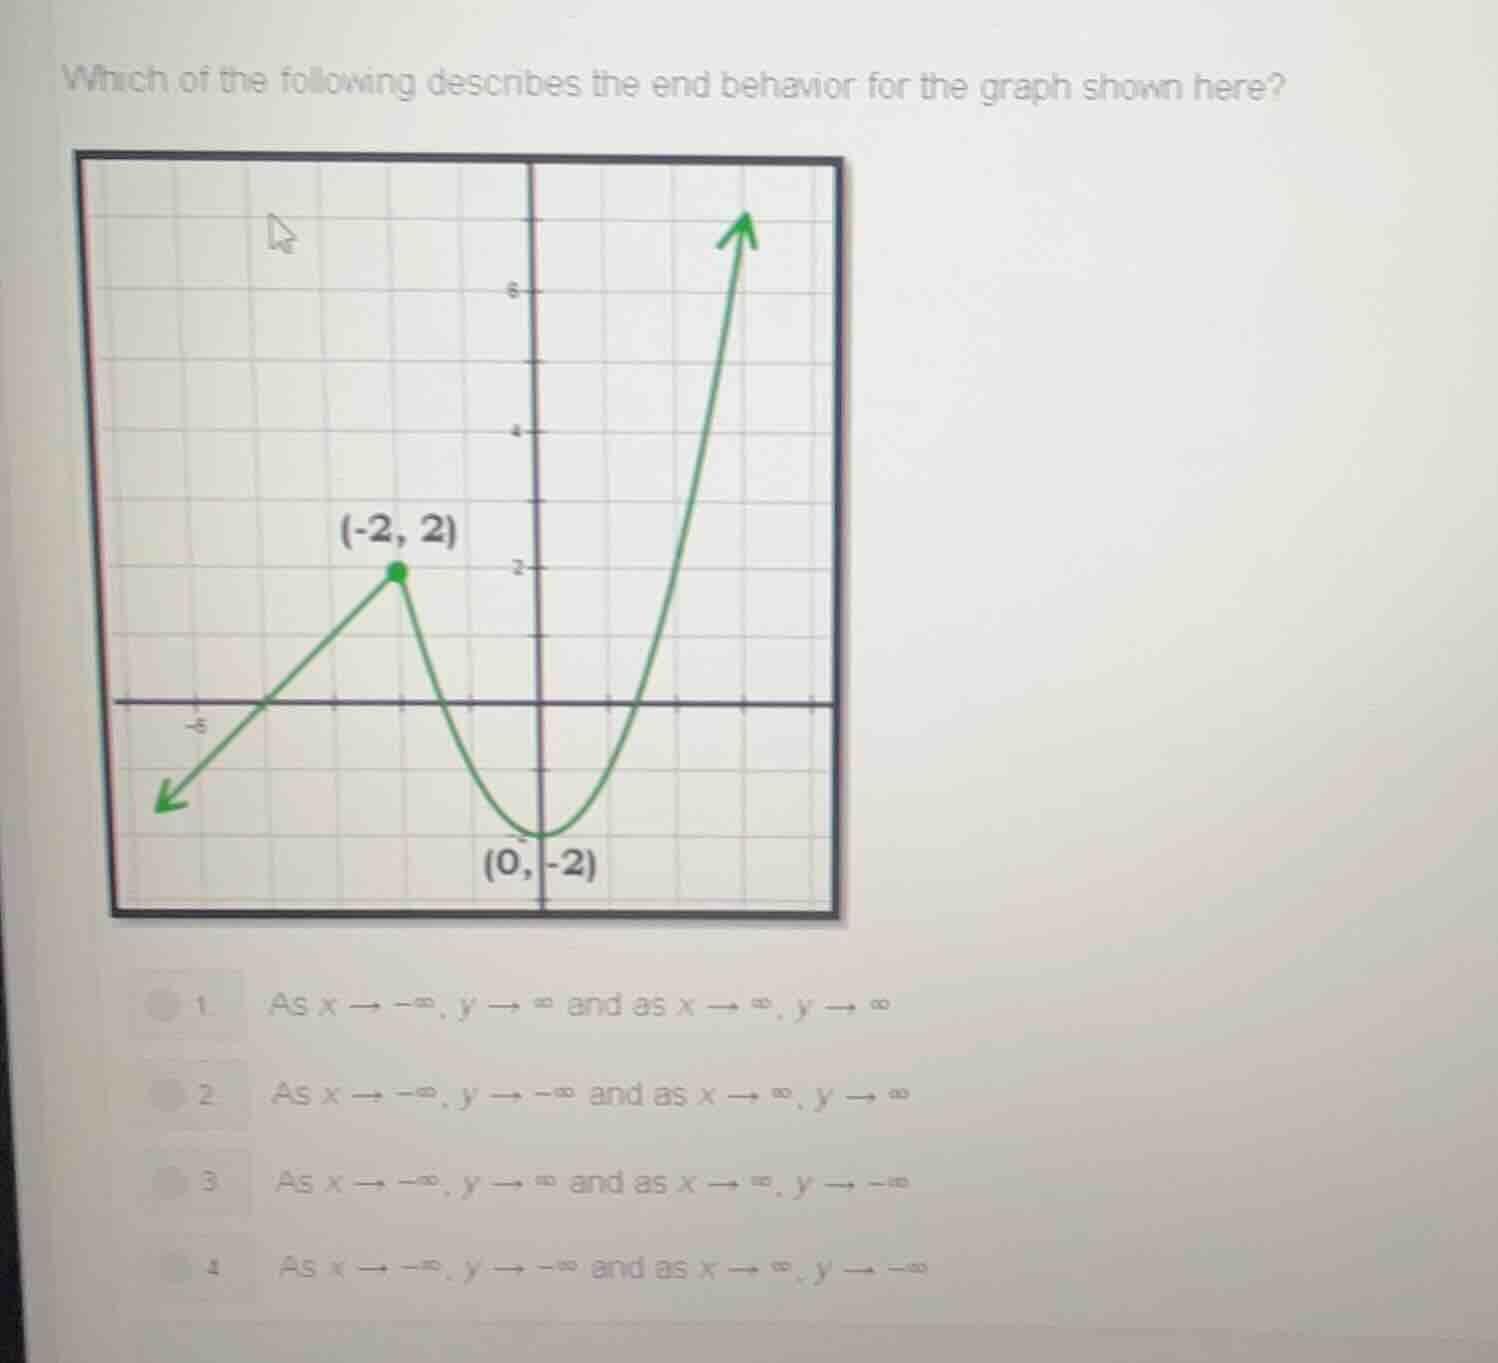
which of the following describes the end behavior for the graph shown here? 1. as ( x \to -infty ), ( y \to infty ) and as ( x \to infty ), ( y \to infty ) 2. as ( x \to -infty ), ( y \to -infty ) and as ( x \to infty ), ( y \to infty ) 3. as ( x \to -infty ), ( y \to infty ) and as ( x \to infty ), ( y \to -infty ) 4. as ( x \to -infty ), ( y \to -infty ) and as ( x \to infty ), ( y \to -infty )
Step1: Analyze left end behavior
Look at the graph as \( x \to -\infty \). The left - most part of the graph (the line segment) is going downwards, so as \( x \) approaches negative infinity, \( y \) approaches negative infinity.
Step2: Analyze right end behavior
Look at the graph as \( x \to \infty \). The right - most part of the graph (the parabola - like part) is going upwards, so as \( x \) approaches positive infinity, \( y \) approaches positive infinity.

Snap & solve any problem in the app
Get step-by-step solutions on Sovi AI
Photo-based solutions with guided steps
Explore more problems and detailed explanations
- As \( x \to -\infty \), \( y \to -\infty \) and as \( x \to \infty \), \( y \to \infty \)