QUESTION IMAGE
Question
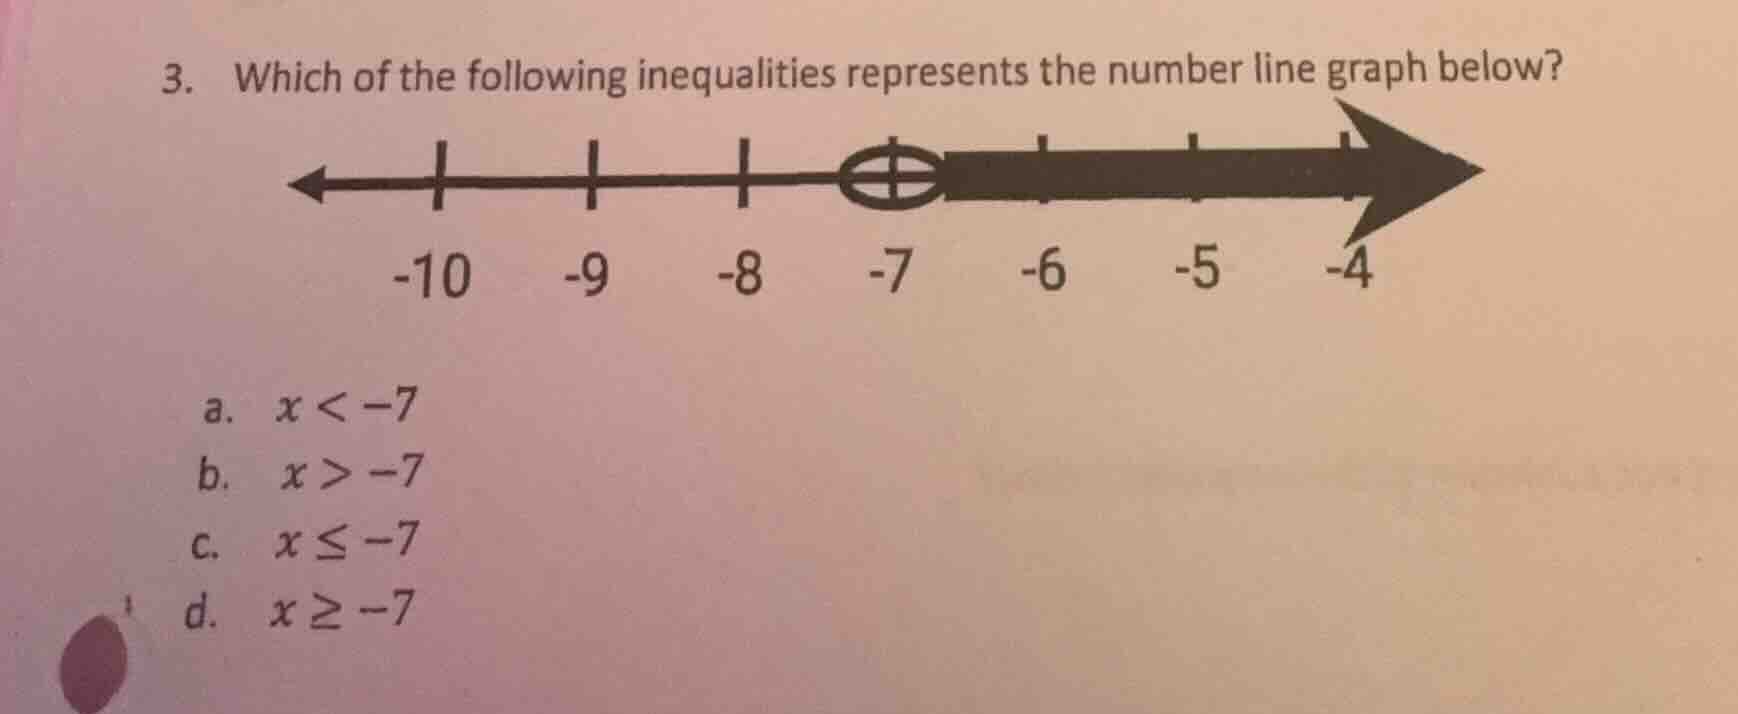
- which of the following inequalities represents the number line graph below?
the number line has marks at -10, -9, -8, -7, -6, -5, -4. there is an open circle at -7 and a shaded arrow pointing to the right (towards -6, -5, -4).
options:
a. $x < -7$
b. $x > -7$
c. $x \leq -7$
d. $x \geq -7$
Step1: Analyze the number line
The graph has an open circle at $-7$, meaning $-7$ is not included. The arrow points right, indicating values greater than $-7$.
Step2: Match to inequality
An open circle at $-7$ with rightward direction corresponds to $x > -7$.

Snap & solve any problem in the app
Get step-by-step solutions on Sovi AI
Photo-based solutions with guided steps
Explore more problems and detailed explanations
b. $x > -7$