QUESTION IMAGE
Question
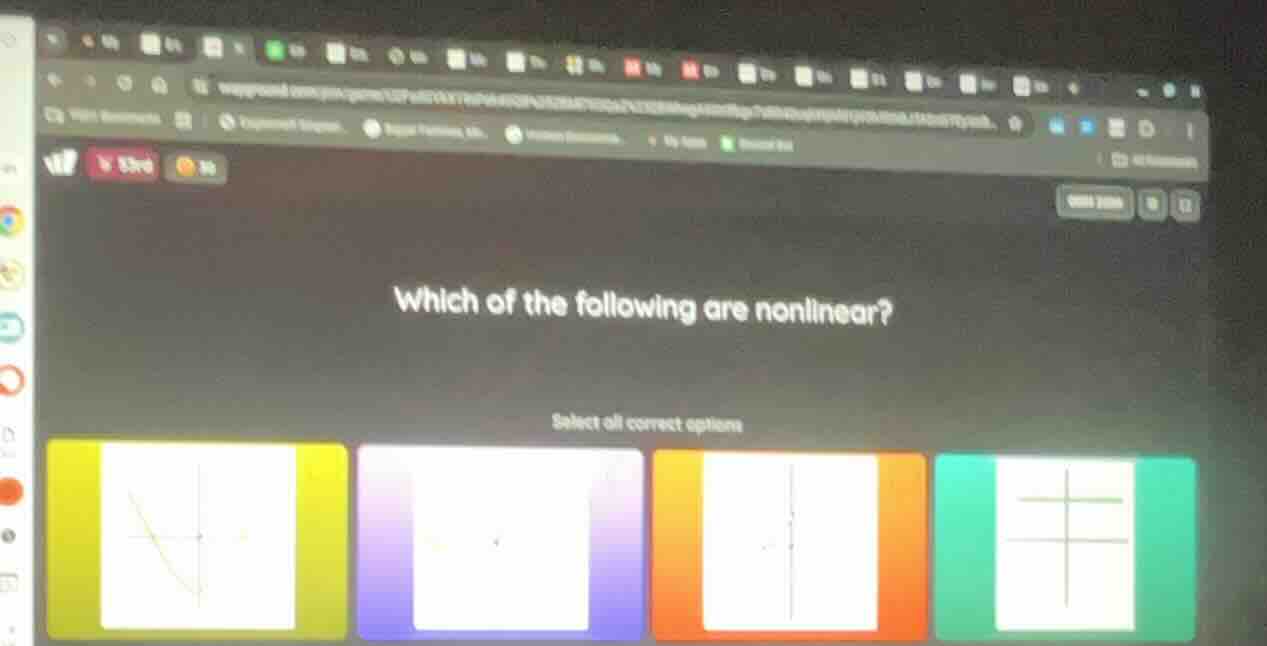
which of the following are nonlinear? select all correct options
To determine which graphs are nonlinear, we recall that a linear graph is a straight line (representing a linear function, like \( y = mx + b \)), while a nonlinear graph has a curved shape (representing a nonlinear function, like quadratic, exponential, etc.).
Analyzing each option:
- Yellow graph: It is a curve (parabola - shape of a quadratic function), so it is nonlinear.
- Purple graph: If it is a straight line (e.g., a linear function), it is linear. But if it is curved, it would be nonlinear. However, based on typical problem setups, the purple graph here likely represents a linear relationship (straight line), so it is linear.
- Orange graph: A vertical line (\( x = \text{constant} \)) is not a function (fails the vertical line test) and is not a linear function (linear functions have the form \( y = mx + b \), and a vertical line cannot be written in this form). However, in some contexts, vertical lines are considered "non - linear" in the sense of not representing a linear function. But more commonly, the key distinction is between straight (linear) and curved (nonlinear) for functions. Since a vertical line is not a function, but the yellow graph is a curved function (quadratic), it is nonlinear.
- Teal graph: Horizontal and vertical lines (the coordinate axes or similar) represent linear relationships (horizontal line: \( y = \text{constant} \), vertical line: \( x = \text{constant} \), but \( y = \text{constant} \) is linear).
A nonlinear graph is not a straight line. The yellow graph is a curve (e.g., a parabola, representing a quadratic function), so it is nonlinear. The orange graph (vertical line) is not a linear function (as linear functions have the form \( y = mx + b \) and a vertical line cannot be expressed this way), and the yellow graph’s curved shape confirms it is nonlinear. The purple and teal graphs (if they are straight lines) are linear.

Snap & solve any problem in the app
Get step-by-step solutions on Sovi AI
Photo-based solutions with guided steps
Explore more problems and detailed explanations
The yellow - colored graph (and the orange - colored graph, depending on interpretation, but the most distinct nonlinear is the yellow curved graph) is nonlinear. If we consider the options by their visual:
- The yellow graph (curved, quadratic - like) is nonlinear.
- The orange graph (vertical line, not a linear function) can also be considered nonlinear in the context of non - linear functions.
(Assuming the yellow graph is the curved one and the orange is a vertical line, the correct nonlinear graphs are the yellow and orange ones. But based on typical K - 12 problem framing, the yellow curved graph is the primary nonlinear one.)