QUESTION IMAGE
Question
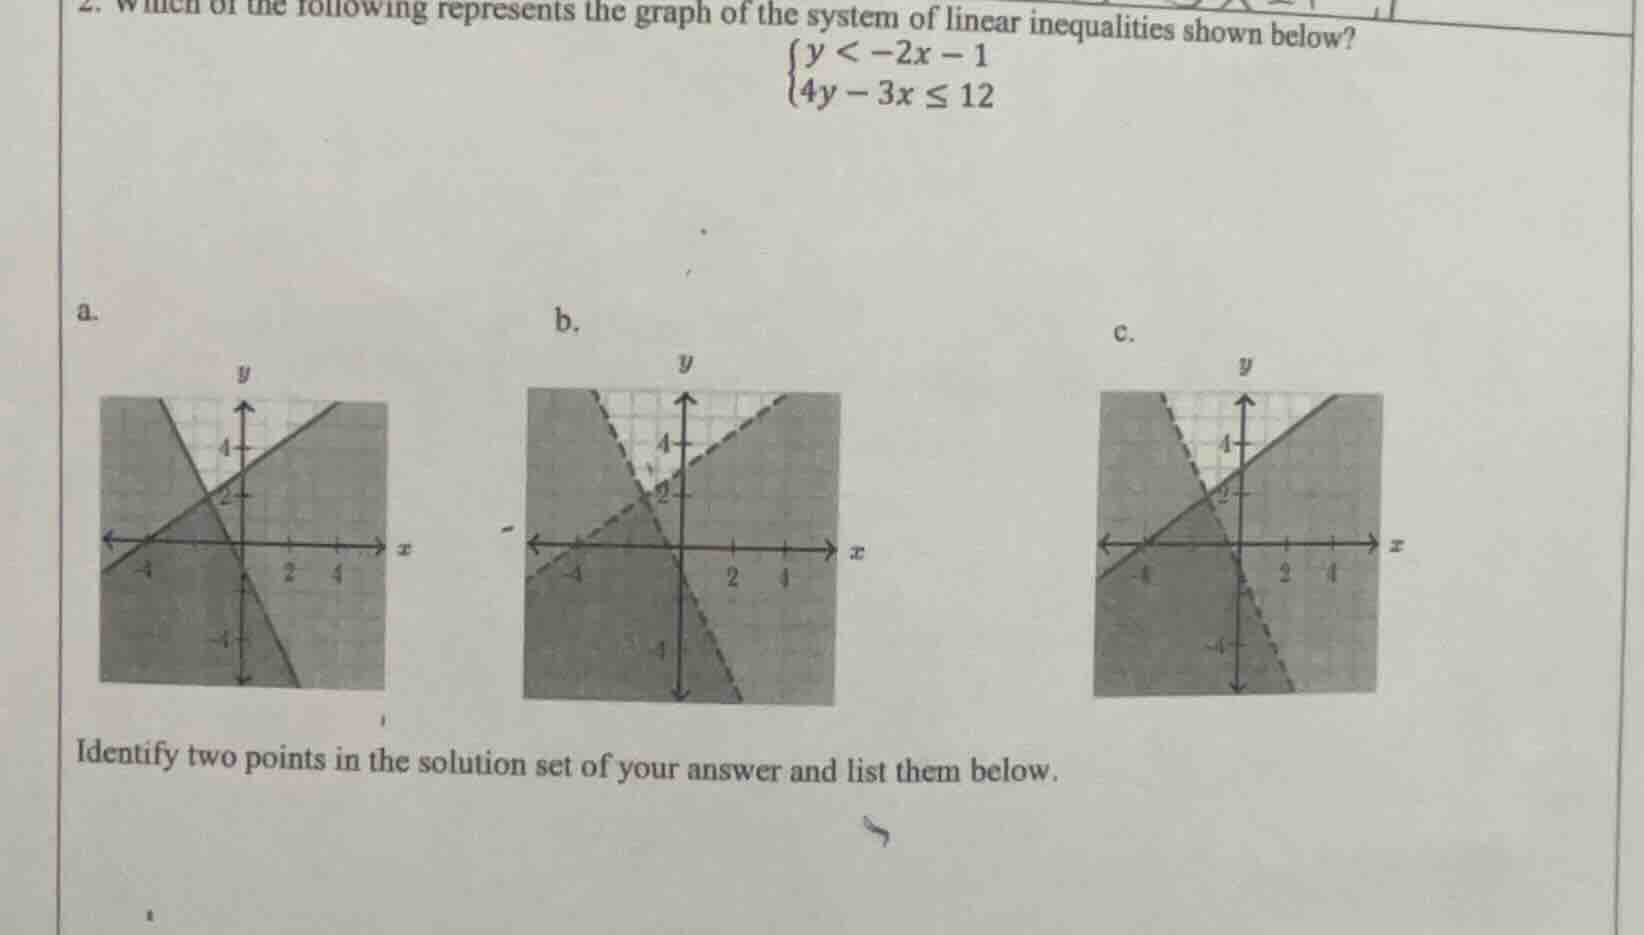
- which of the following represents the graph of the system of linear inequalities shown below?$\begin{cases} y < -2x - 1 \\ 4y - 3x leq 12 end{cases}$a.b.c.identify two points in the solution set of your answer and list them below.
Step1: Rewrite 2nd inequality to slope-intercept
Solve $4y - 3x \leq 12$ for $y$:
$$\begin{align*}
4y &\leq 3x + 12 \\
y &\leq \frac{3}{4}x + 3
\end{align*}$$
Step2: Analyze line styles
- $y < -2x -1$: strict inequality → dashed line; shade below the line.
- $y \leq \frac{3}{4}x + 3$: non-strict inequality → solid line; shade below the line.
Step3: Match to correct graph
Only option c has a dashed line for $y < -2x -1$ and solid line for $y \leq \frac{3}{4}x + 3$, with shading in the overlapping region below both lines.
Step4: Verify solution points
Test $(0, -2)$:
- $-2 < -2(0) -1 \implies -2 < -1$ (true)
- $4(-2) -3(0) = -8 \leq 12$ (true)
Test $(2, -5)$:
- $-5 < -2(2) -1 \implies -5 < -5$? No, test $(3, -7)$:
- $-7 < -2(3)-1 \implies -7 < -7$? No, test $(1, -4)$:
- $-4 < -2(1)-1 \implies -4 < -3$ (true)
- $4(-4)-3(1) = -19 \leq 12$ (true)

Snap & solve any problem in the app
Get step-by-step solutions on Sovi AI
Photo-based solutions with guided steps
Explore more problems and detailed explanations
Correct graph: c.
Two points in the solution set: $(0, -2)$, $(1, -4)$