QUESTION IMAGE
Question
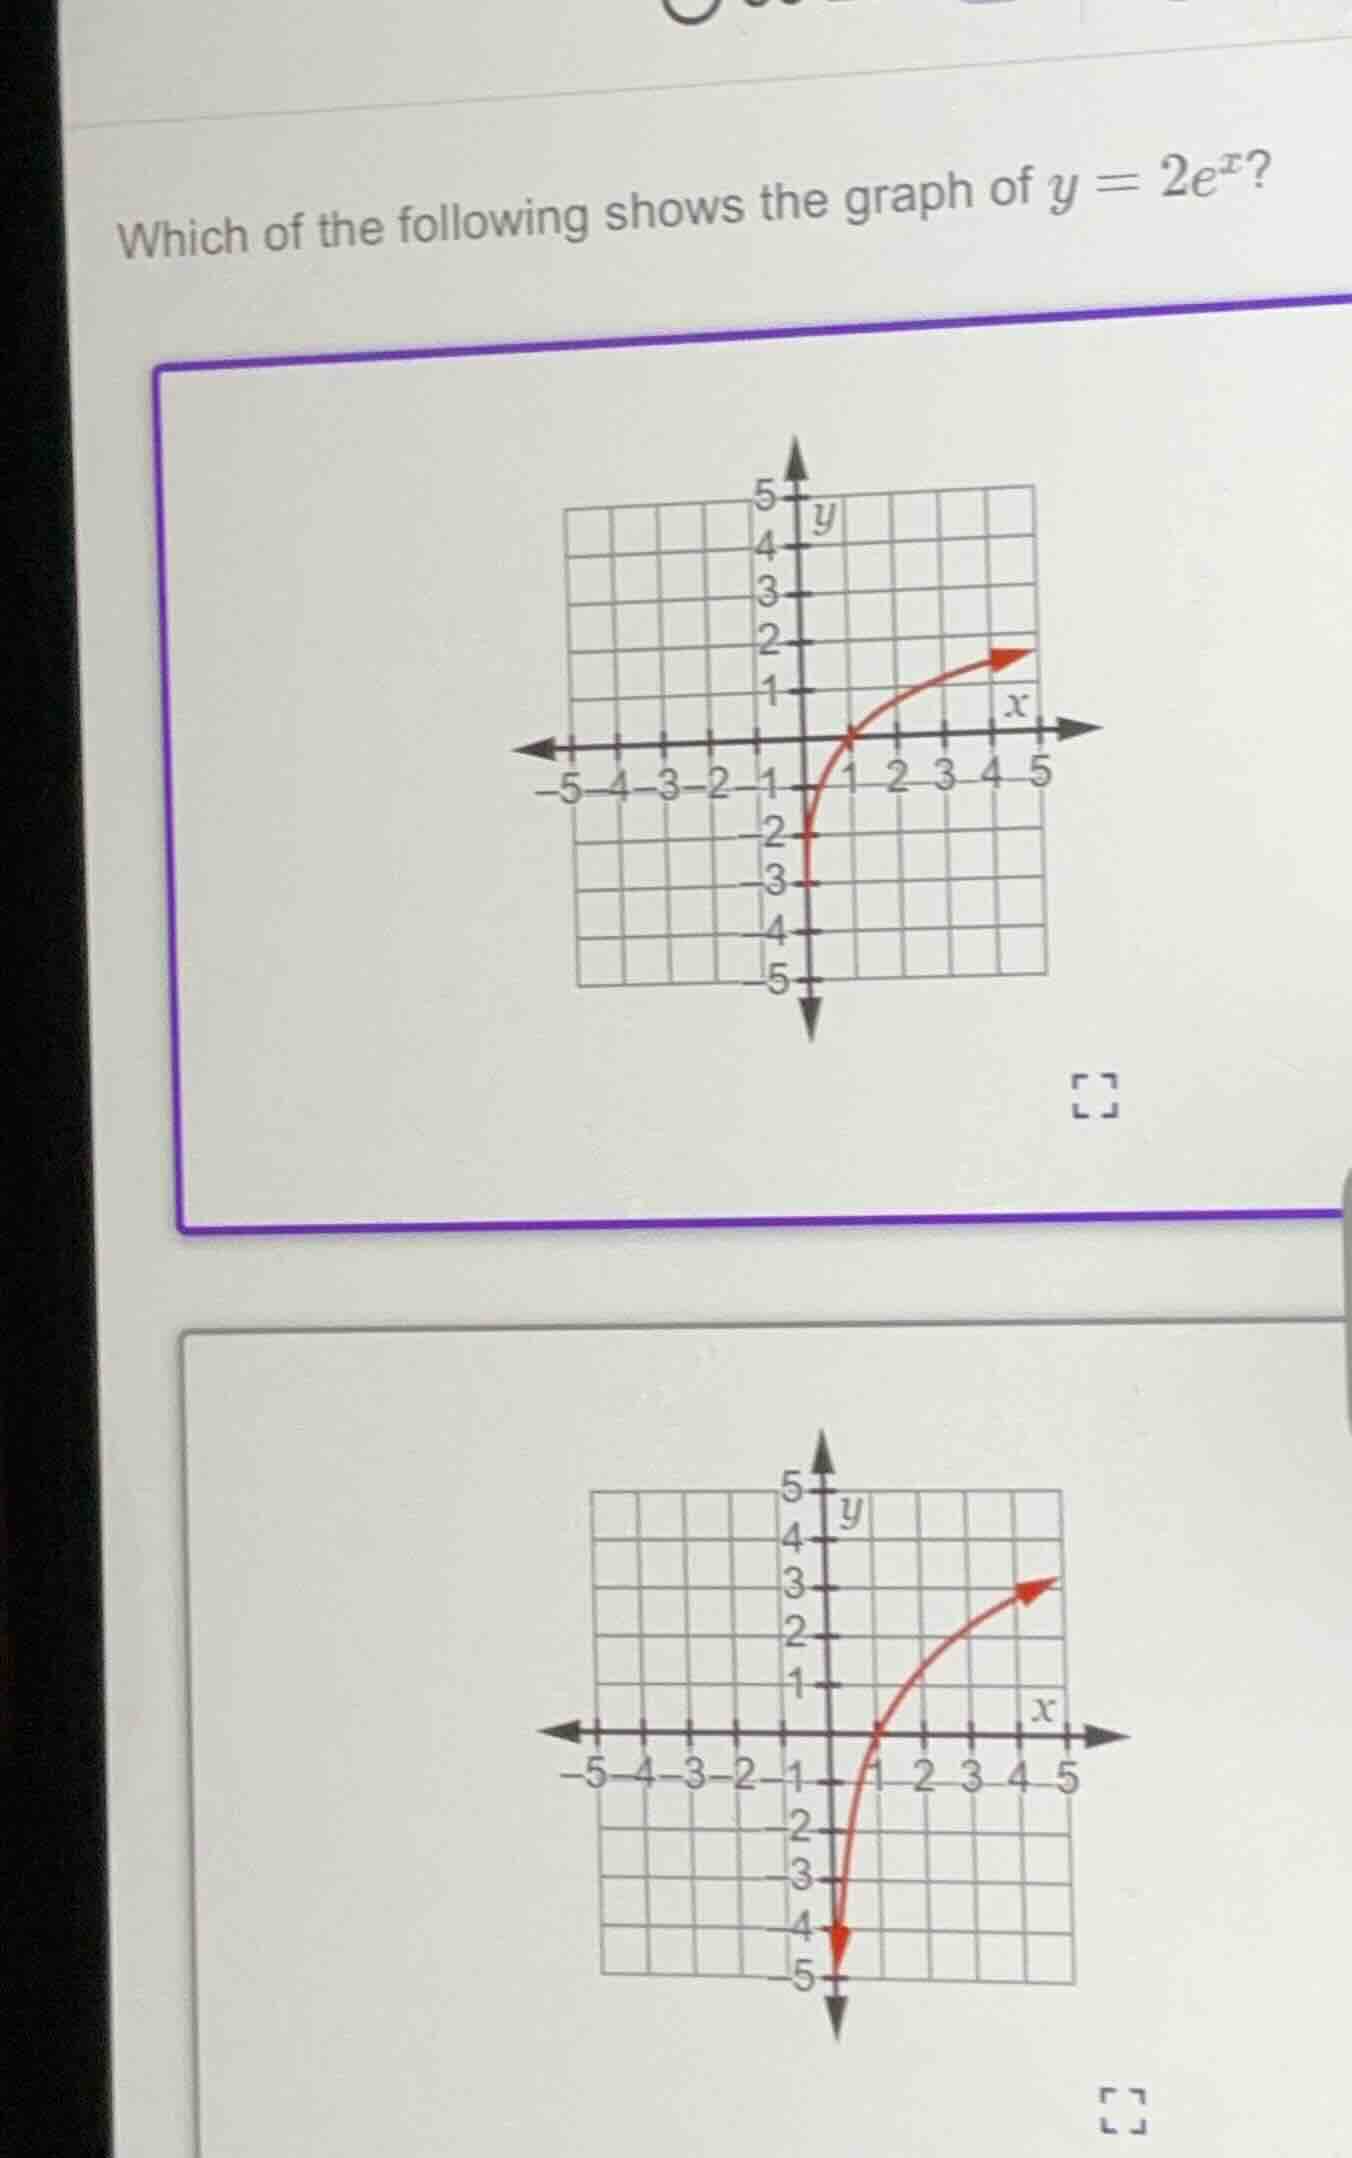
which of the following shows the graph of $y = 2e^x$?
Step1: Find y-intercept (x=0)
$y=2e^{0}=2\times1=2$
Step2: Analyze function behavior
As $x\to+\infty$, $y=2e^x\to+\infty$; as $x\to-\infty$, $y=2e^x\to0^+$
Step3: Match with given graphs
The top graph has y-intercept near 2, approaches 0 as $x\to-\infty$, and increases to $+\infty$ as $x\to+\infty$, which matches.

Snap & solve any problem in the app
Get step-by-step solutions on Sovi AI
Photo-based solutions with guided steps
Explore more problems and detailed explanations
The top graph (the one with the red curve starting near (0,2), approaching 0 as x goes to negative infinity, and increasing towards positive infinity as x goes to positive infinity) is the graph of $y=2e^x$.