QUESTION IMAGE
Question
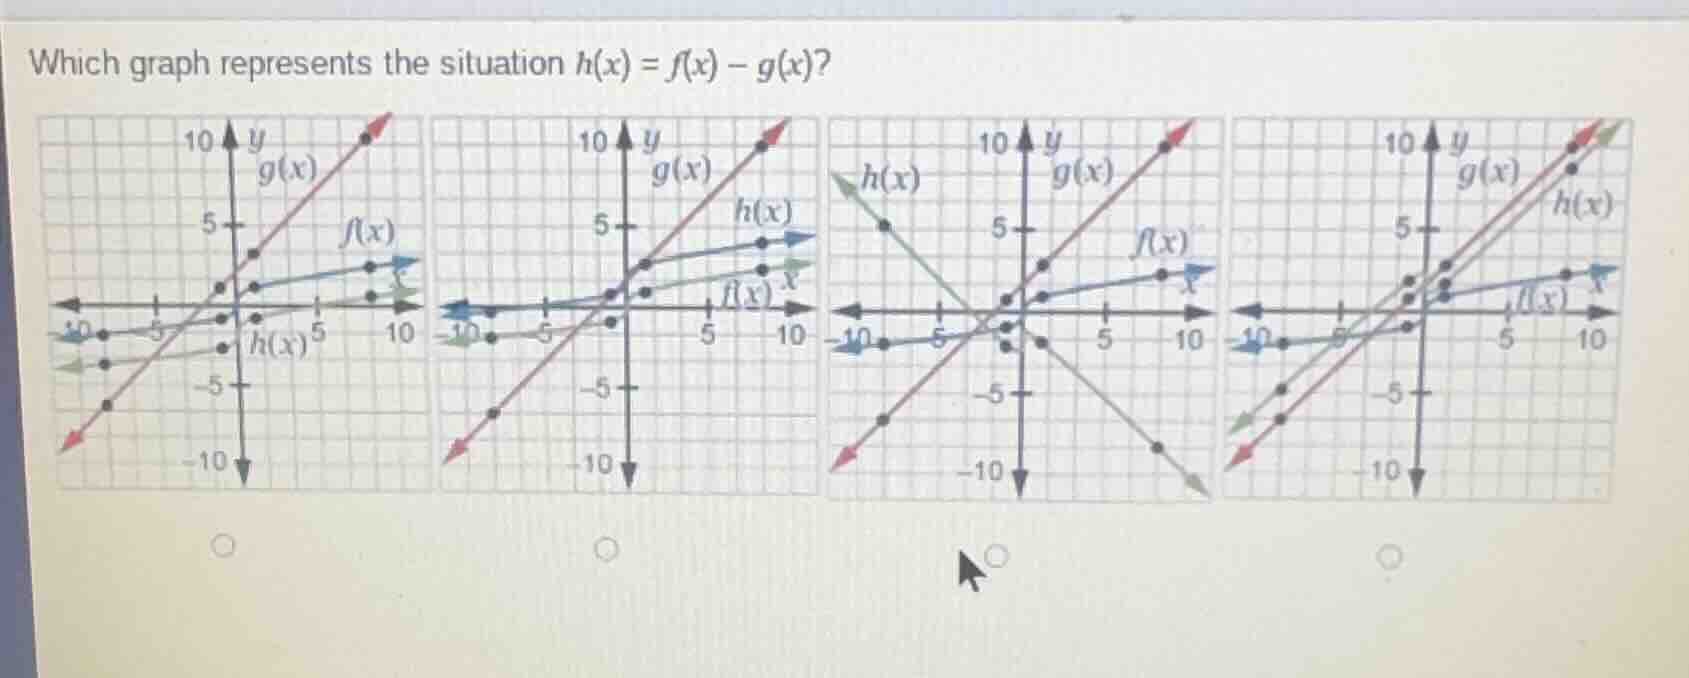
which graph represents the situation $h(x) = f(x) - g(x)$?
Step1: Define linear functions
First, identify equations for $f(x)$ and $g(x)$ from their graphs.
- $f(x)$ is a horizontal line: $f(x) = 1$
- $g(x)$ has slope $1$, y-intercept $0$: $g(x) = x$
Step2: Calculate $h(x)=f(x)-g(x)$
Substitute the functions into the formula.
$h(x) = 1 - x$
Step3: Analyze $h(x)$ properties
$h(x)=-x+1$ has:
- Slope $-1$ (decreasing line)
- Y-intercept $(0,1)$
- X-intercept $(1,0)$

Snap & solve any problem in the app
Get step-by-step solutions on Sovi AI
Photo-based solutions with guided steps
Explore more problems and detailed explanations
The third graph (with the downward-sloping $h(x)$ line passing through $(0,1)$ and $(1,0)$)