QUESTION IMAGE
Question
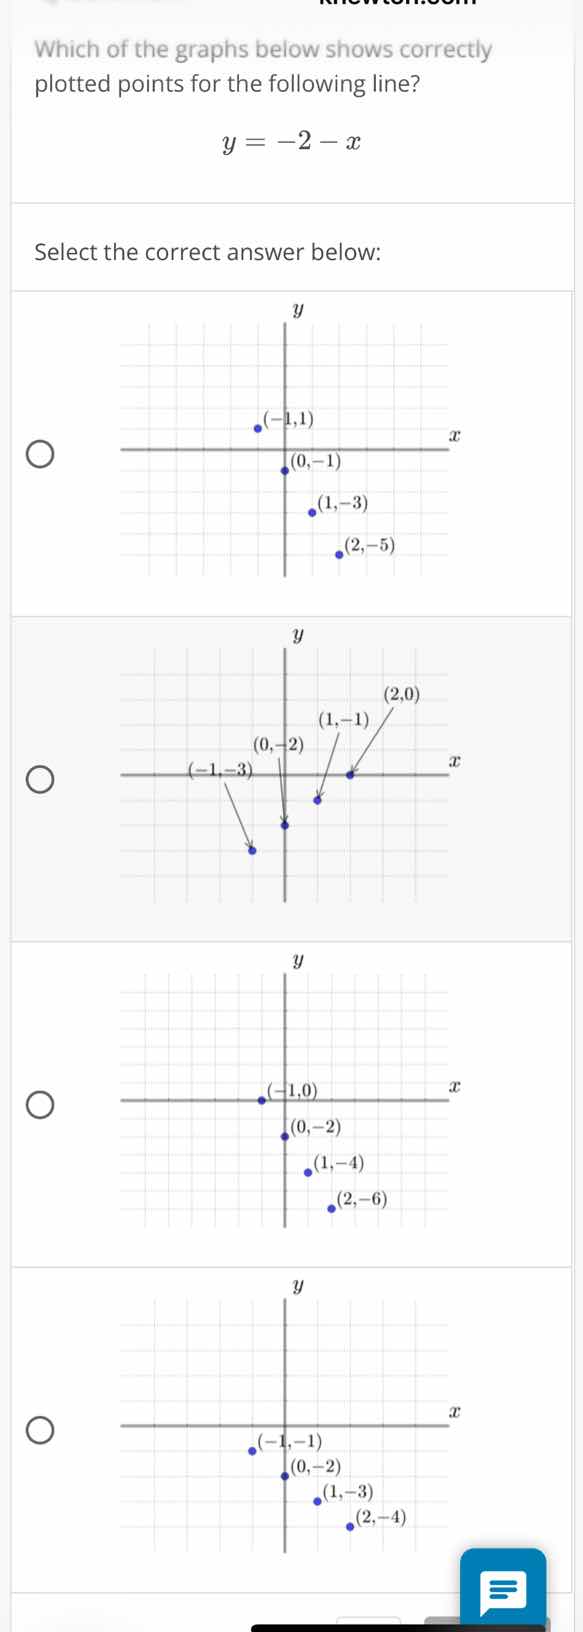
which of the graphs below shows correctly plotted points for the following line?
$y = -2 - x$
select the correct answer below:
Step1: Calculate y for x=-1
Substitute $x=-1$ into $y=-2-x$:
$y=-2-(-1)=-2+1=-1$
Step2: Calculate y for x=0
Substitute $x=0$ into $y=-2-x$:
$y=-2-0=-2$
Step3: Calculate y for x=1
Substitute $x=1$ into $y=-2-x$:
$y=-2-1=-3$
Step4: Calculate y for x=2
Substitute $x=2$ into $y=-2-x$:
$y=-2-2=-4$
Step5: Match to correct graph
The valid points are $(-1,-1)$, $(0,-2)$, $(1,-3)$, $(2,-4)$.

Snap & solve any problem in the app
Get step-by-step solutions on Sovi AI
Photo-based solutions with guided steps
Explore more problems and detailed explanations
The bottom-most graph with points $(-1,-1)$, $(0,-2)$, $(1,-3)$, $(2,-4)$