QUESTION IMAGE
Question
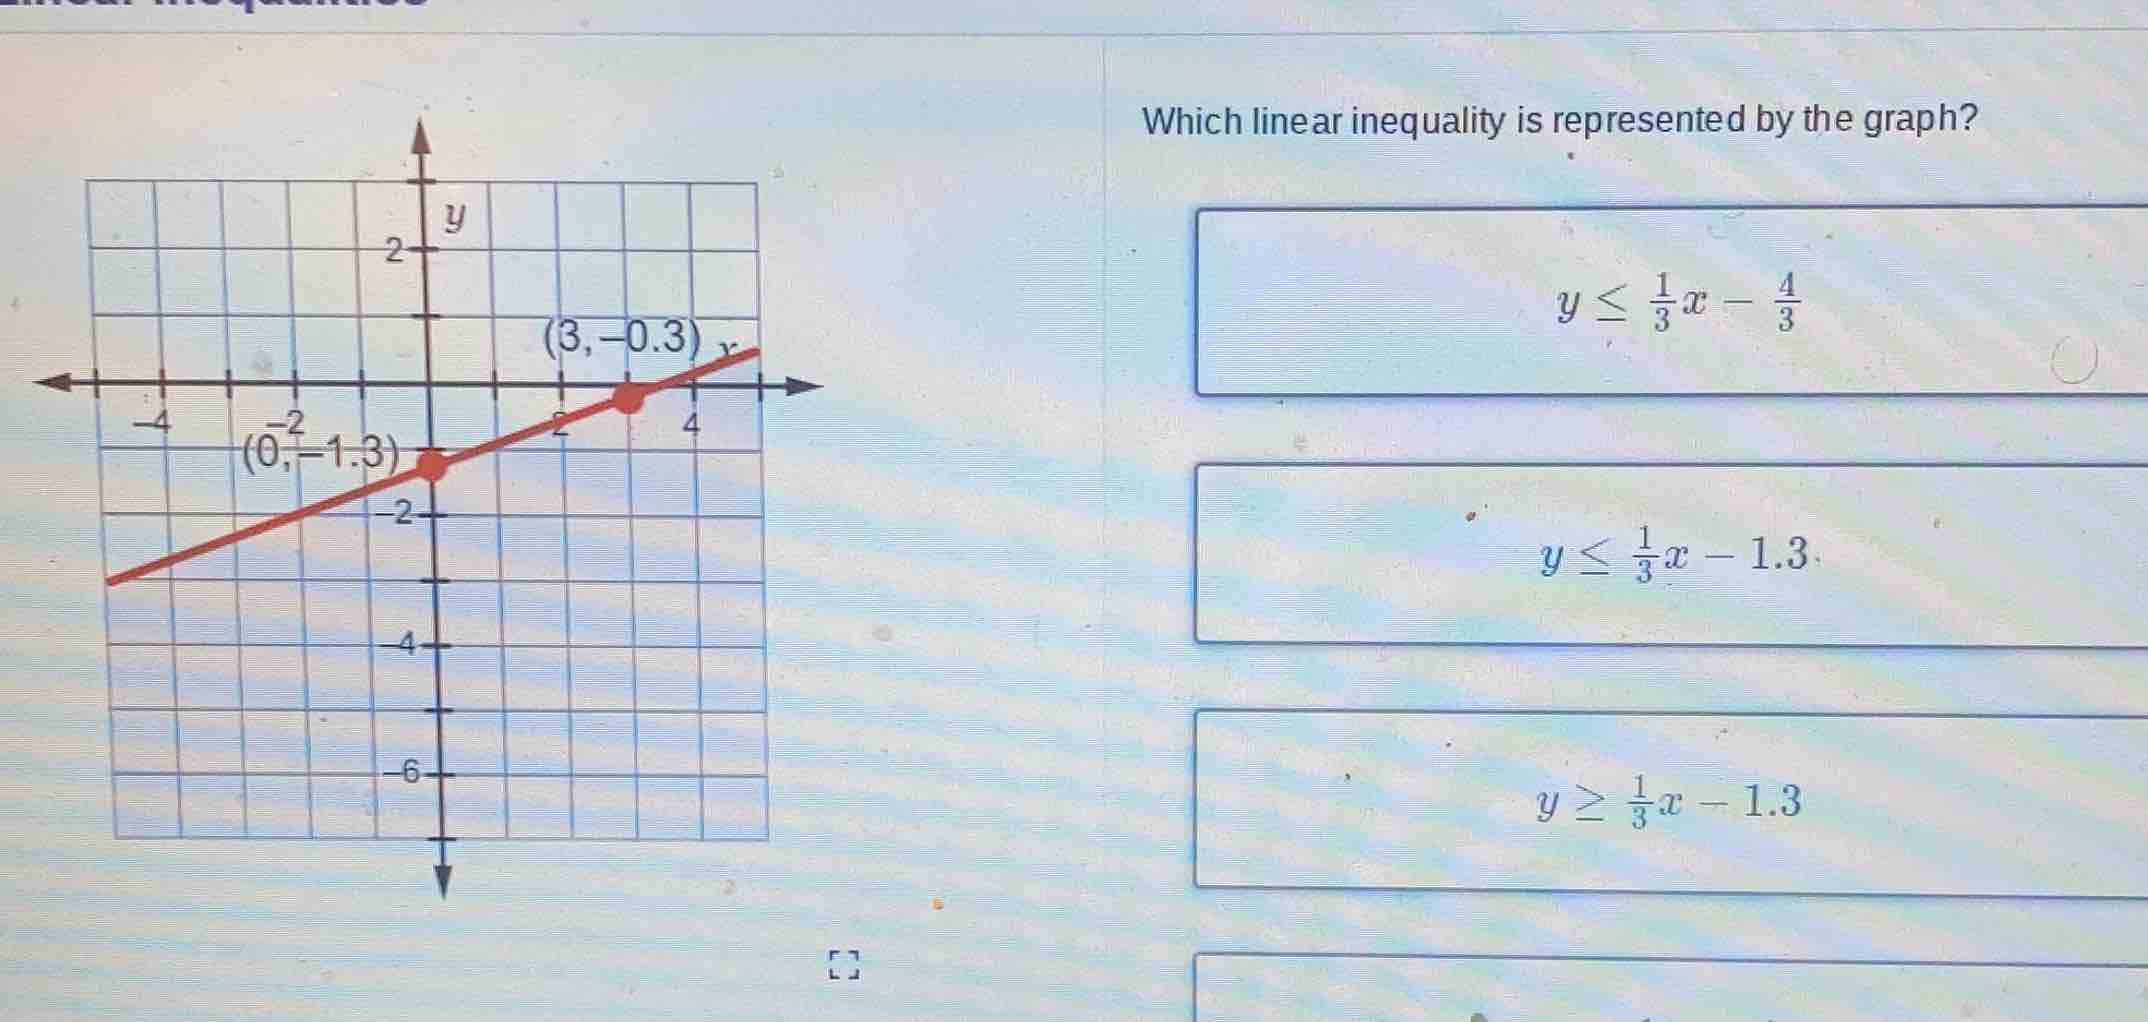
which linear inequality is represented by the graph?
$y \leq \frac{1}{3}x - \frac{4}{3}$
$y \leq \frac{1}{3}x - 1.3$
$y \geq \frac{1}{3}x - 1.3$
Step1: Find slope of the line
The slope $m$ between points $(x_1,y_1)=(0,-1.3)$ and $(x_2,y_2)=(3,-0.3)$ is calculated as:
$$m=\frac{y_2-y_1}{x_2-x_1}=\frac{-0.3-(-1.3)}{3-0}=\frac{1}{3}$$
Step2: Identify y-intercept
The line crosses the y-axis at $(0,-1.3)$, so the y-intercept $b=-1.3$. The line equation is $y=\frac{1}{3}x-1.3$.
Step3: Determine inequality sign
The line is solid, and the shaded region is below the line, so we use $\leq$.
Step4: Match with options
The inequality matches $y \leq \frac{1}{3}x - 1.3$. We can also verify $\frac{4}{3}\approx1.333$, which does not match the y-intercept of $-1.3$ in the graph, so the first option is incorrect.

Snap & solve any problem in the app
Get step-by-step solutions on Sovi AI
Photo-based solutions with guided steps
Explore more problems and detailed explanations
$y \leq \frac{1}{3}x - 1.3$