QUESTION IMAGE
Question
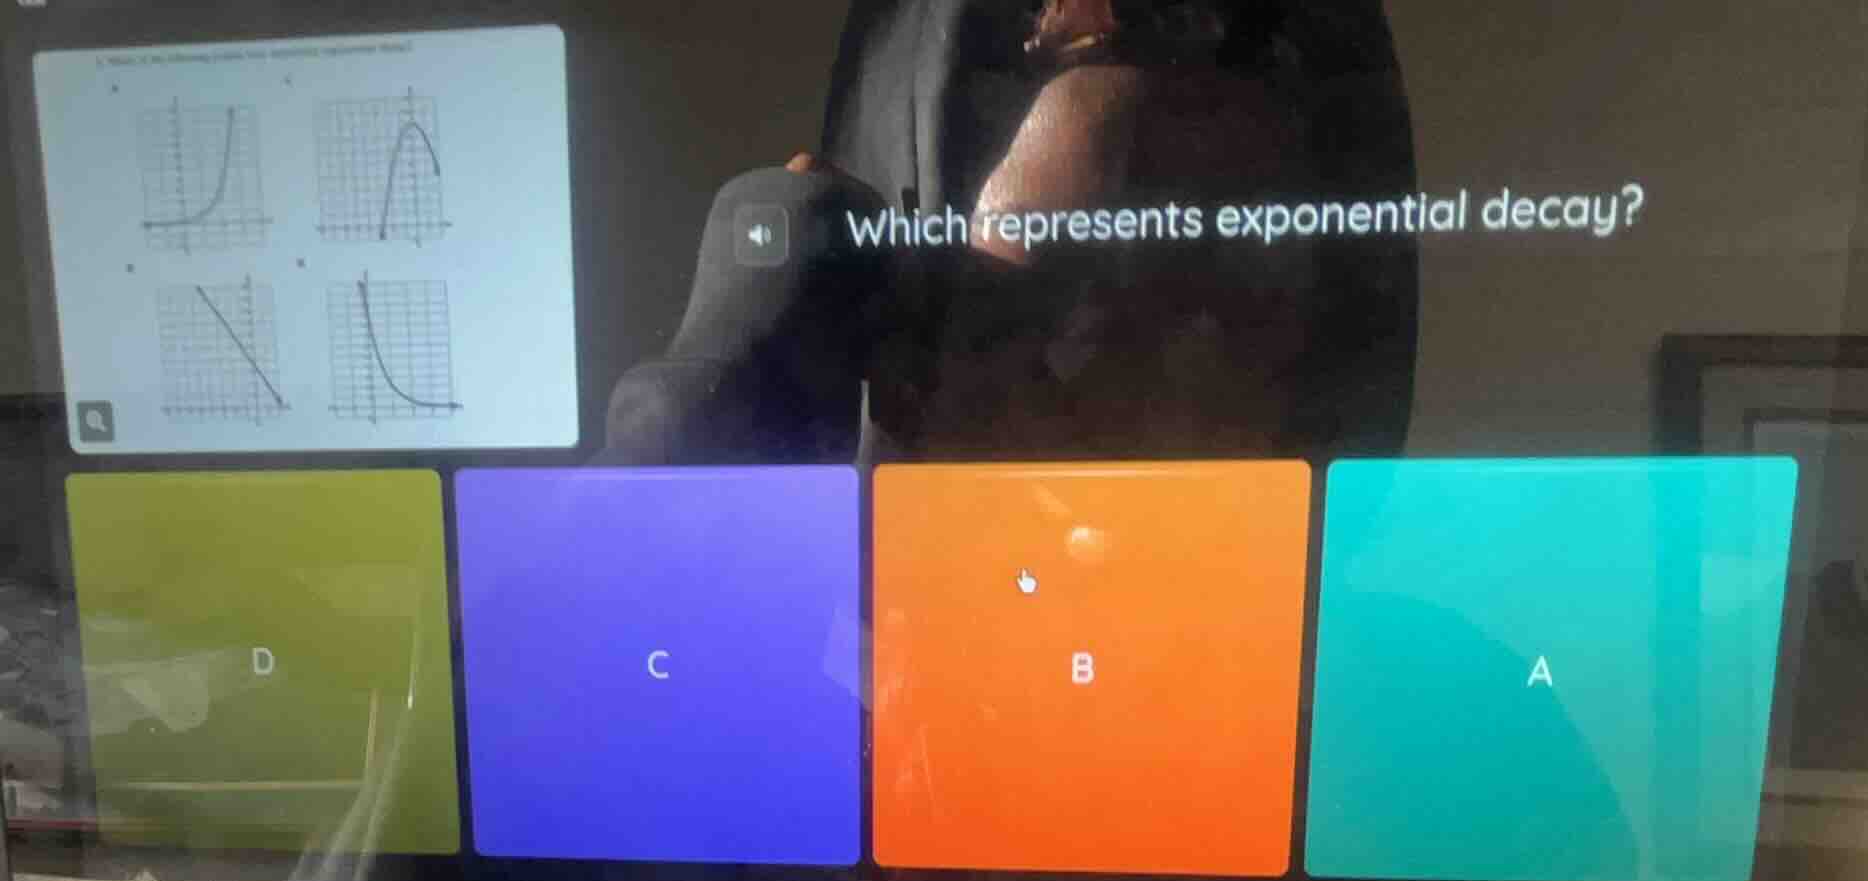
which represents exponential decay?
options: a, b, c, d (with four graphs in the image: one increasing curve, one parabola - like curve, one straight - line decreasing, one curve decreasing towards a horizontal asymptote)
Step1: Recall exponential decay graph properties
An exponential decay function has the form \( y = ab^x \) where \( 0 < b < 1 \). Its graph should be a curve that decreases rapidly at first and then slows down, approaching the x - axis (but never touching it) as \( x\) increases. A linear function has a straight - line graph, a quadratic function (like a parabola) has a U - shape or an inverted U - shape, and an exponential growth function (\( b>1\)) increases rapidly as \( x\) increases.
Step2: Analyze each graph
- The first graph (top - left) is increasing rapidly, so it represents exponential growth.
- The second graph (top - right) is a parabola (quadratic function), so it's not exponential decay.
- The third graph (bottom - left) is a straight line, so it's a linear function, not exponential decay.
- The fourth graph (bottom - right) is a curve that decreases and approaches the x - axis as \( x\) increases, which matches the properties of an exponential decay function. Assuming the fourth graph corresponds to option D (since the green box is labeled D and has this curve), this graph represents exponential decay.

Snap & solve any problem in the app
Get step-by-step solutions on Sovi AI
Photo-based solutions with guided steps
Explore more problems and detailed explanations
D (the graph in the green box labeled D, which is a curve decreasing and approaching the x - axis as \( x\) increases)