QUESTION IMAGE
Question
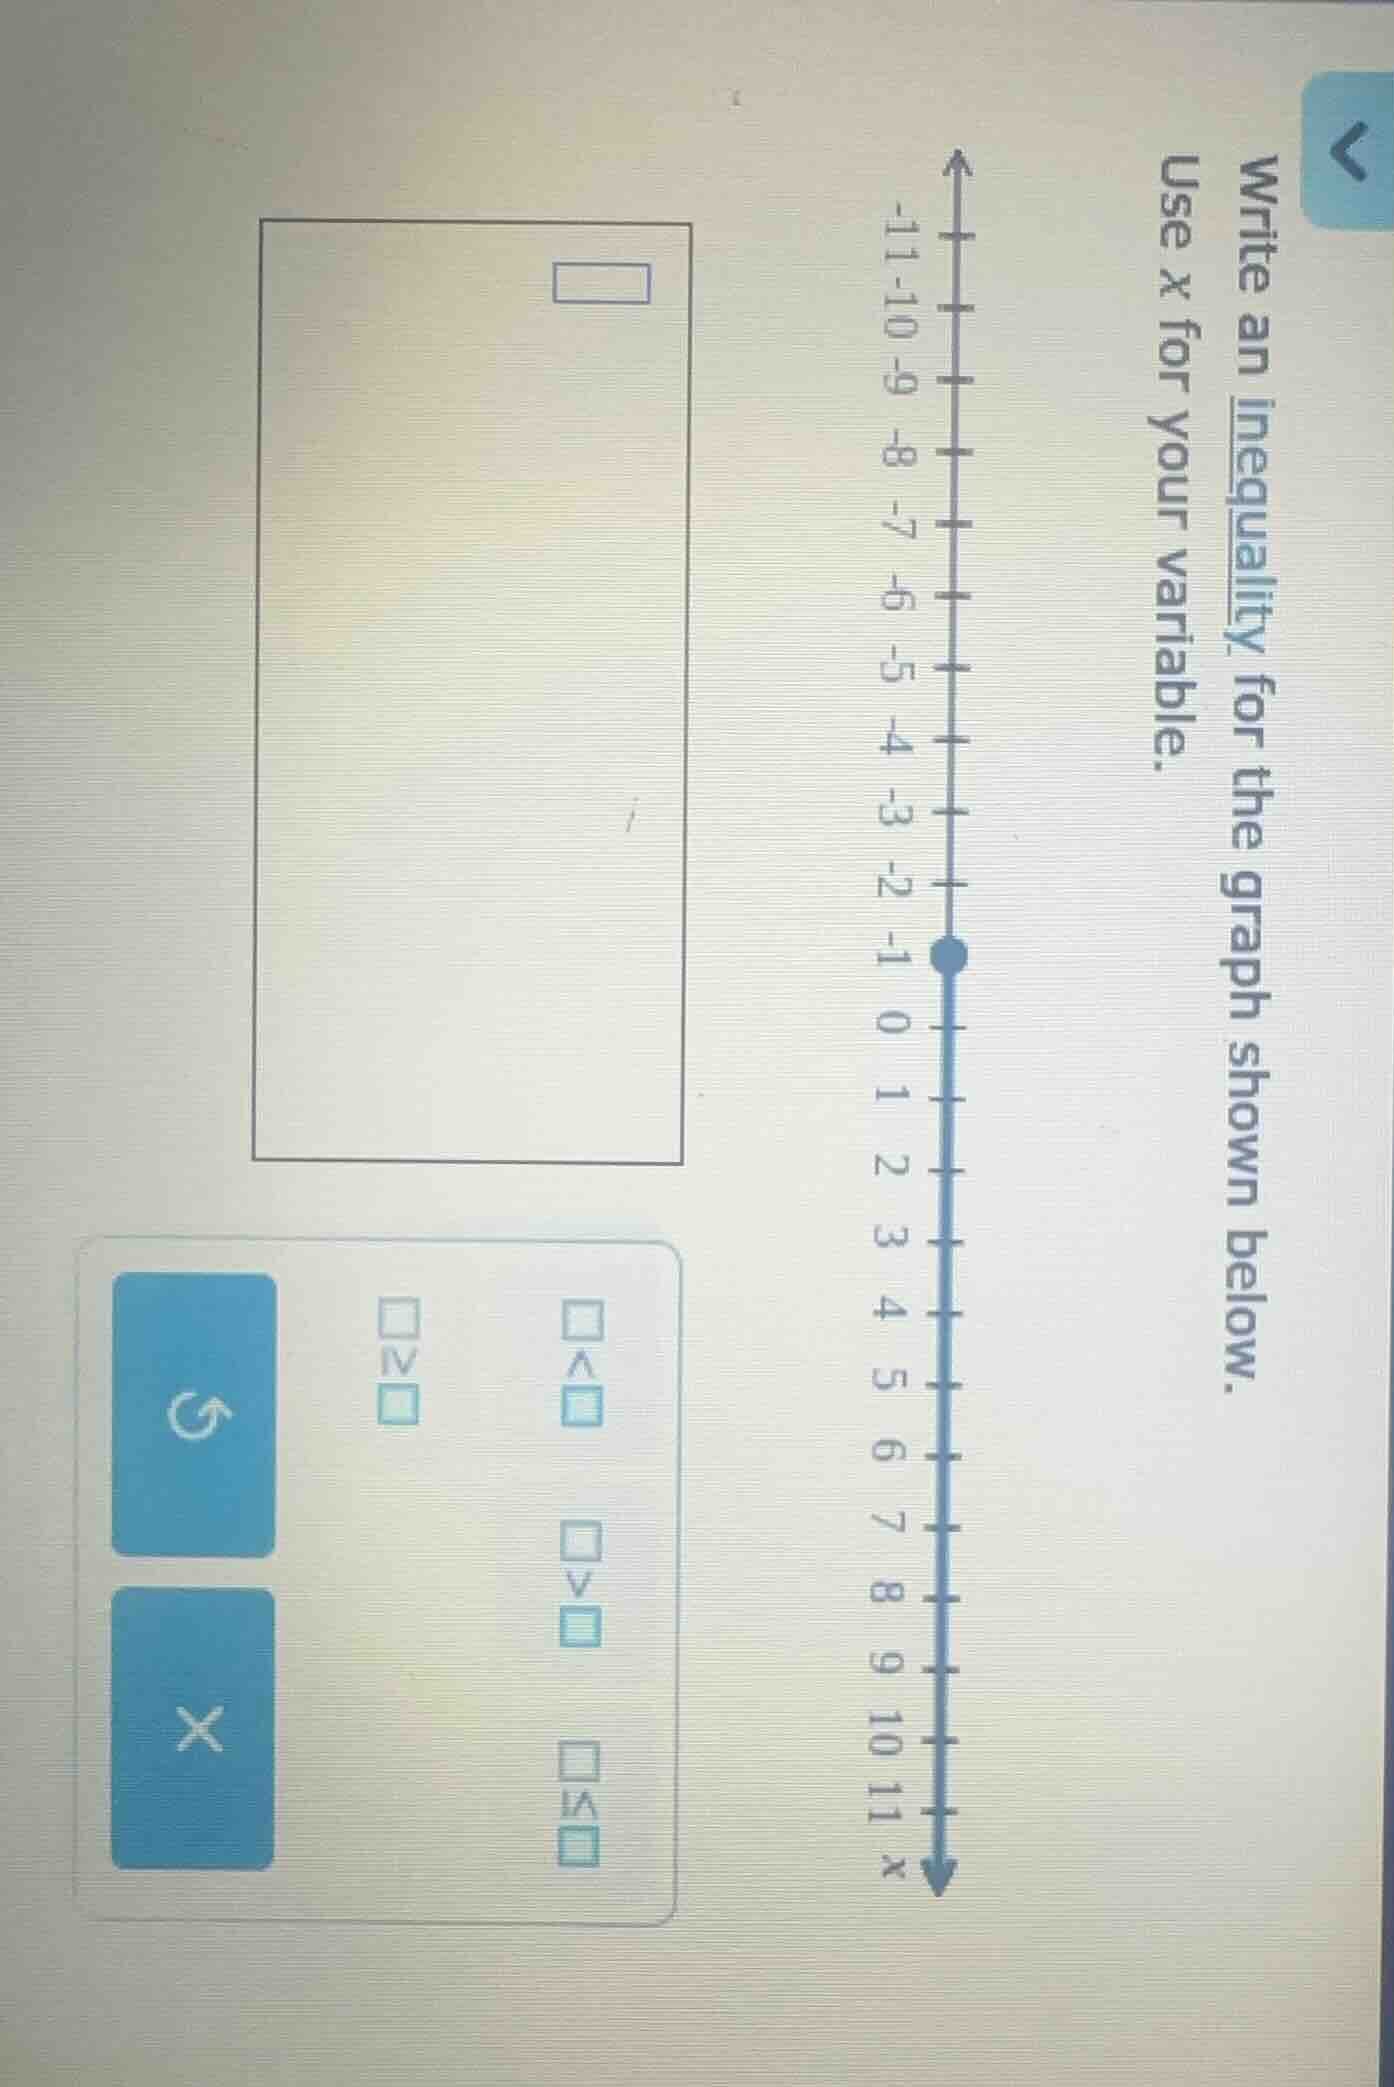
write an inequality for the graph shown below. use x for your variable.
Step1: Analyze the number line
The dot is at -1 and the line is shaded to the right, indicating all numbers greater than or equal to -1.
Step2: Write the inequality
Using \( x \) as the variable, the inequality is \( x \geq -1 \).

Snap & solve any problem in the app
Get step-by-step solutions on Sovi AI
Photo-based solutions with guided steps
Explore more problems and detailed explanations
\( x \geq -1 \)