QUESTION IMAGE
Question
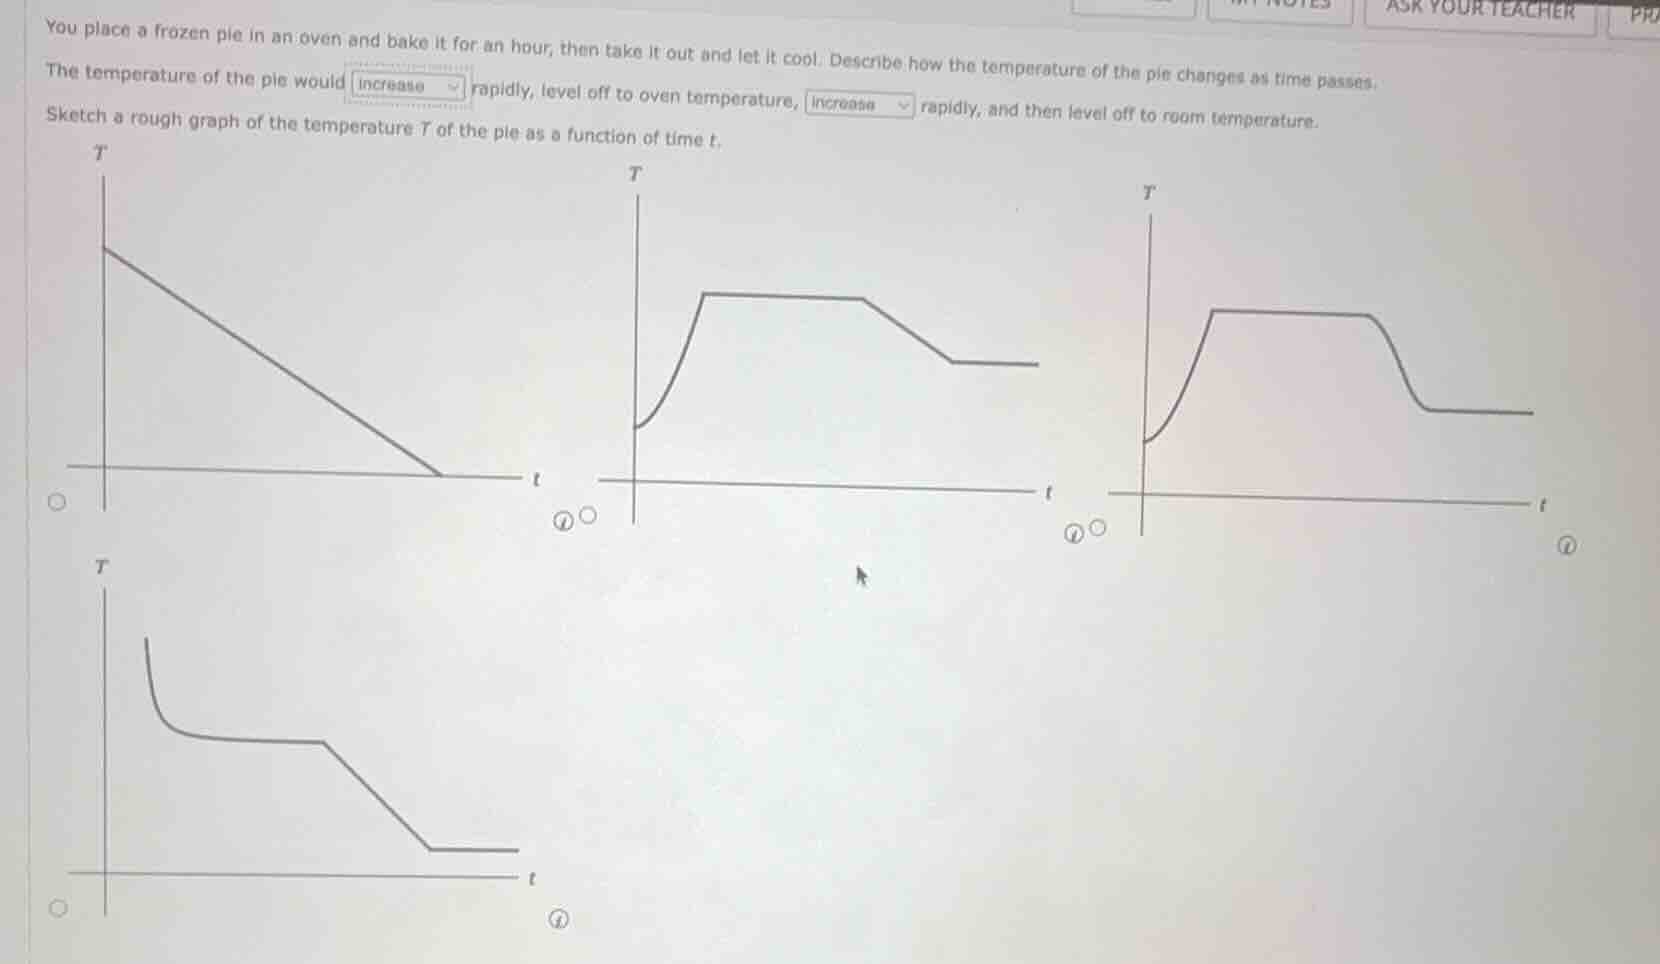
you place a frozen pie in an oven and bake it for an hour, then take it out and let it cool. describe how the temperature of the pie changes as time passes. the temperature of the pie would increase rapidly, level off to oven temperature, increase rapidly, and then level off to room temperature. sketch a rough graph of the temperature t of the pie as a function of time t.
- First, the frozen pie starts at a temperature below room temperature. When placed in the oven, its temperature increases rapidly at first (steep upward slope) as it warms toward the oven's constant temperature.
- Once the pie reaches the oven temperature, it stays at that level (flat horizontal line) for the hour it bakes.
- When removed from the oven, the pie cools: its temperature decreases rapidly at first (steep downward slope) as it loses heat quickly to the cooler room, then the rate of cooling slows down until it levels off at room temperature (final flat horizontal line).
- Matching this sequence, the third graph (top right) shows the correct shape: steep upward rise, flat plateau, steep downward drop, and final flat plateau at a lower temperature than the oven.

Snap & solve any problem in the app
Get step-by-step solutions on Sovi AI
Photo-based solutions with guided steps
Explore more problems and detailed explanations
The correct graph is the top-right option (labeled ③), and the correct word for the second blank is decrease.
The full description is: The temperature of the pie would increase rapidly, level off to oven temperature, decrease rapidly, and then level off to room temperature.