QUESTION IMAGE
Question
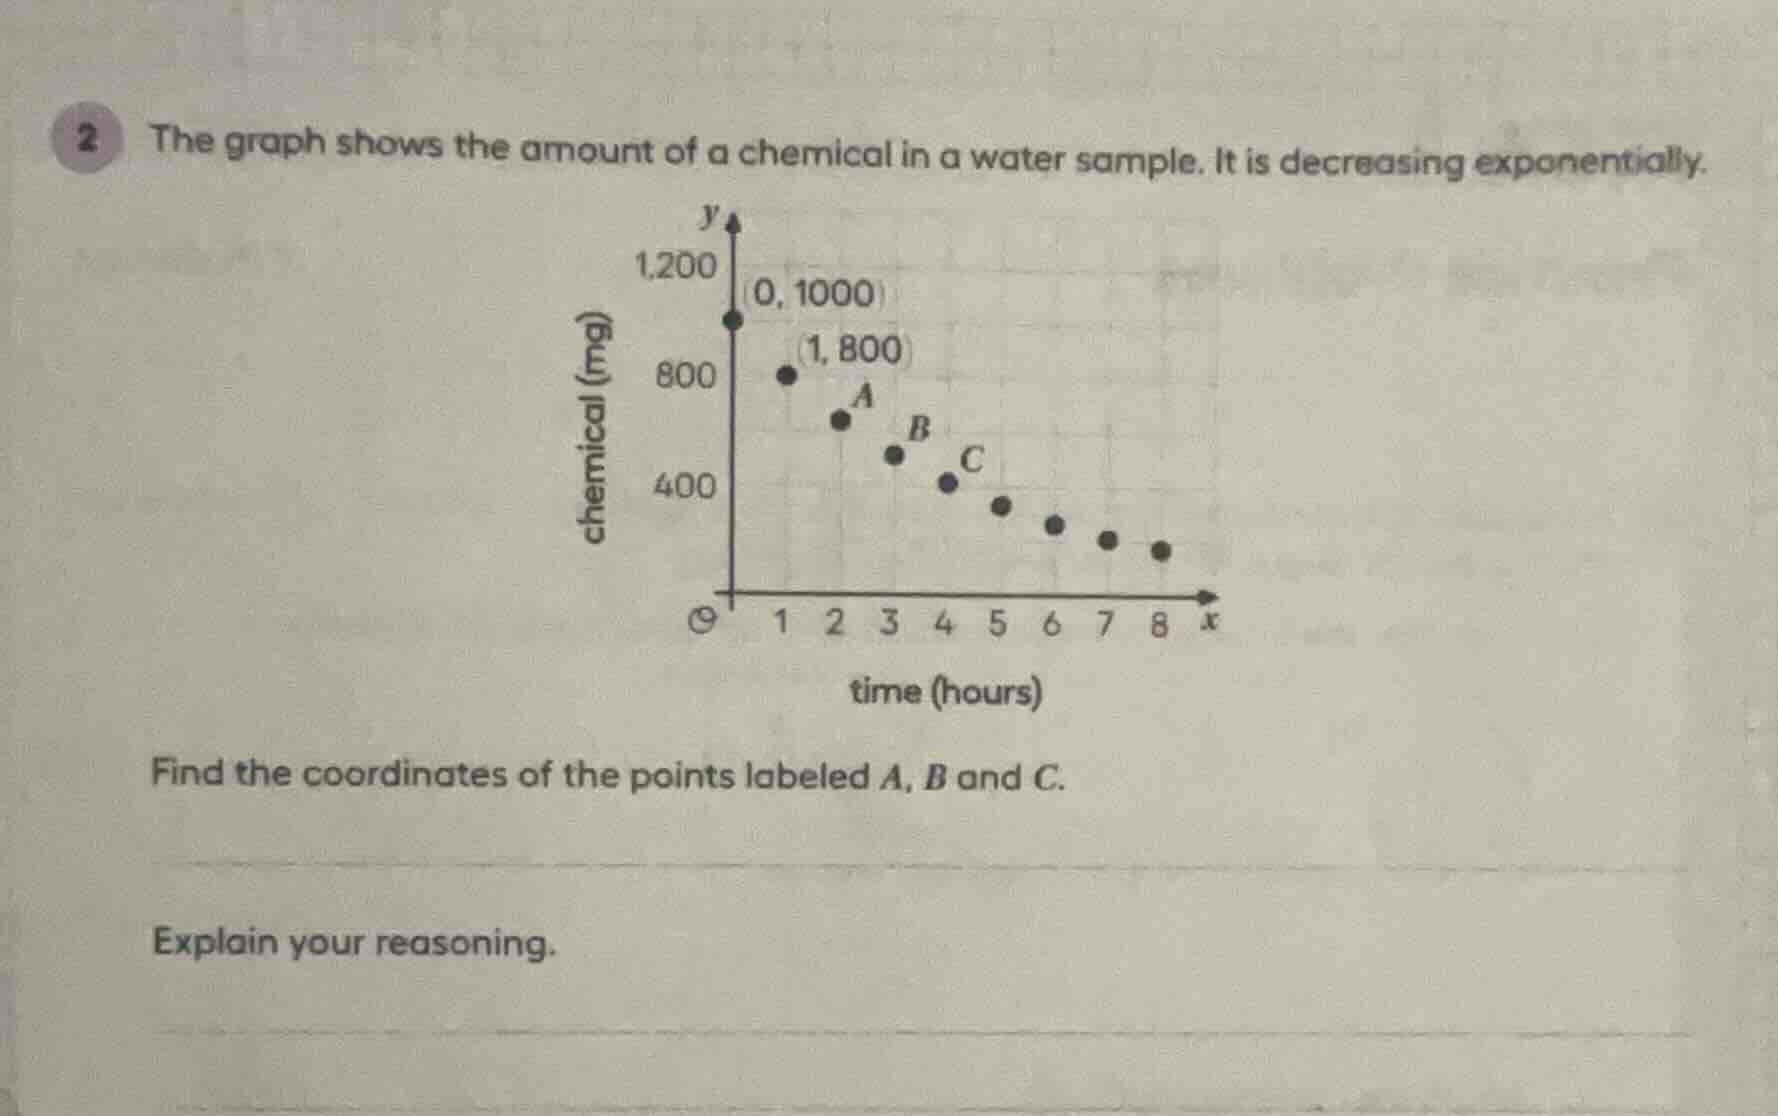
2 the graph shows the amount of a chemical in a water sample. it is decreasing exponentially. find the coordinates of the points labeled a, b and c. explain your reasoning.
Step1: Identify decay model
The exponential decay formula is $y = a(b)^x$, where $a$ is the initial value, $b$ is the decay factor, $x$ is time, and $y$ is the remaining chemical. From the point $(0, 1000)$, $a = 1000$.
Step2: Calculate decay factor $b$
Use the point $(1, 800)$:
$800 = 1000(b)^1$
$b = \frac{800}{1000} = 0.8$
The model is $y = 1000(0.8)^x$.
Step3: Find point A ($x=2$)
Substitute $x=2$ into the model:
$y = 1000(0.8)^2 = 1000(0.64) = 640$
Coordinates of A: $(2, 640)$
Step4: Find point B ($x=3$)
Substitute $x=3$ into the model:
$y = 1000(0.8)^3 = 1000(0.512) = 512$
Coordinates of B: $(3, 512)$
Step5: Find point C ($x=4$)
Substitute $x=4$ into the model:
$y = 1000(0.8)^4 = 1000(0.4096) = 409.6$
Coordinates of C: $(4, 409.6)$

Snap & solve any problem in the app
Get step-by-step solutions on Sovi AI
Photo-based solutions with guided steps
Explore more problems and detailed explanations
- Point A: $(2, 640)$
- Point B: $(3, 512)$
- Point C: $(4, 409.6)$