QUESTION IMAGE
Question
initial knowledge check
question 10
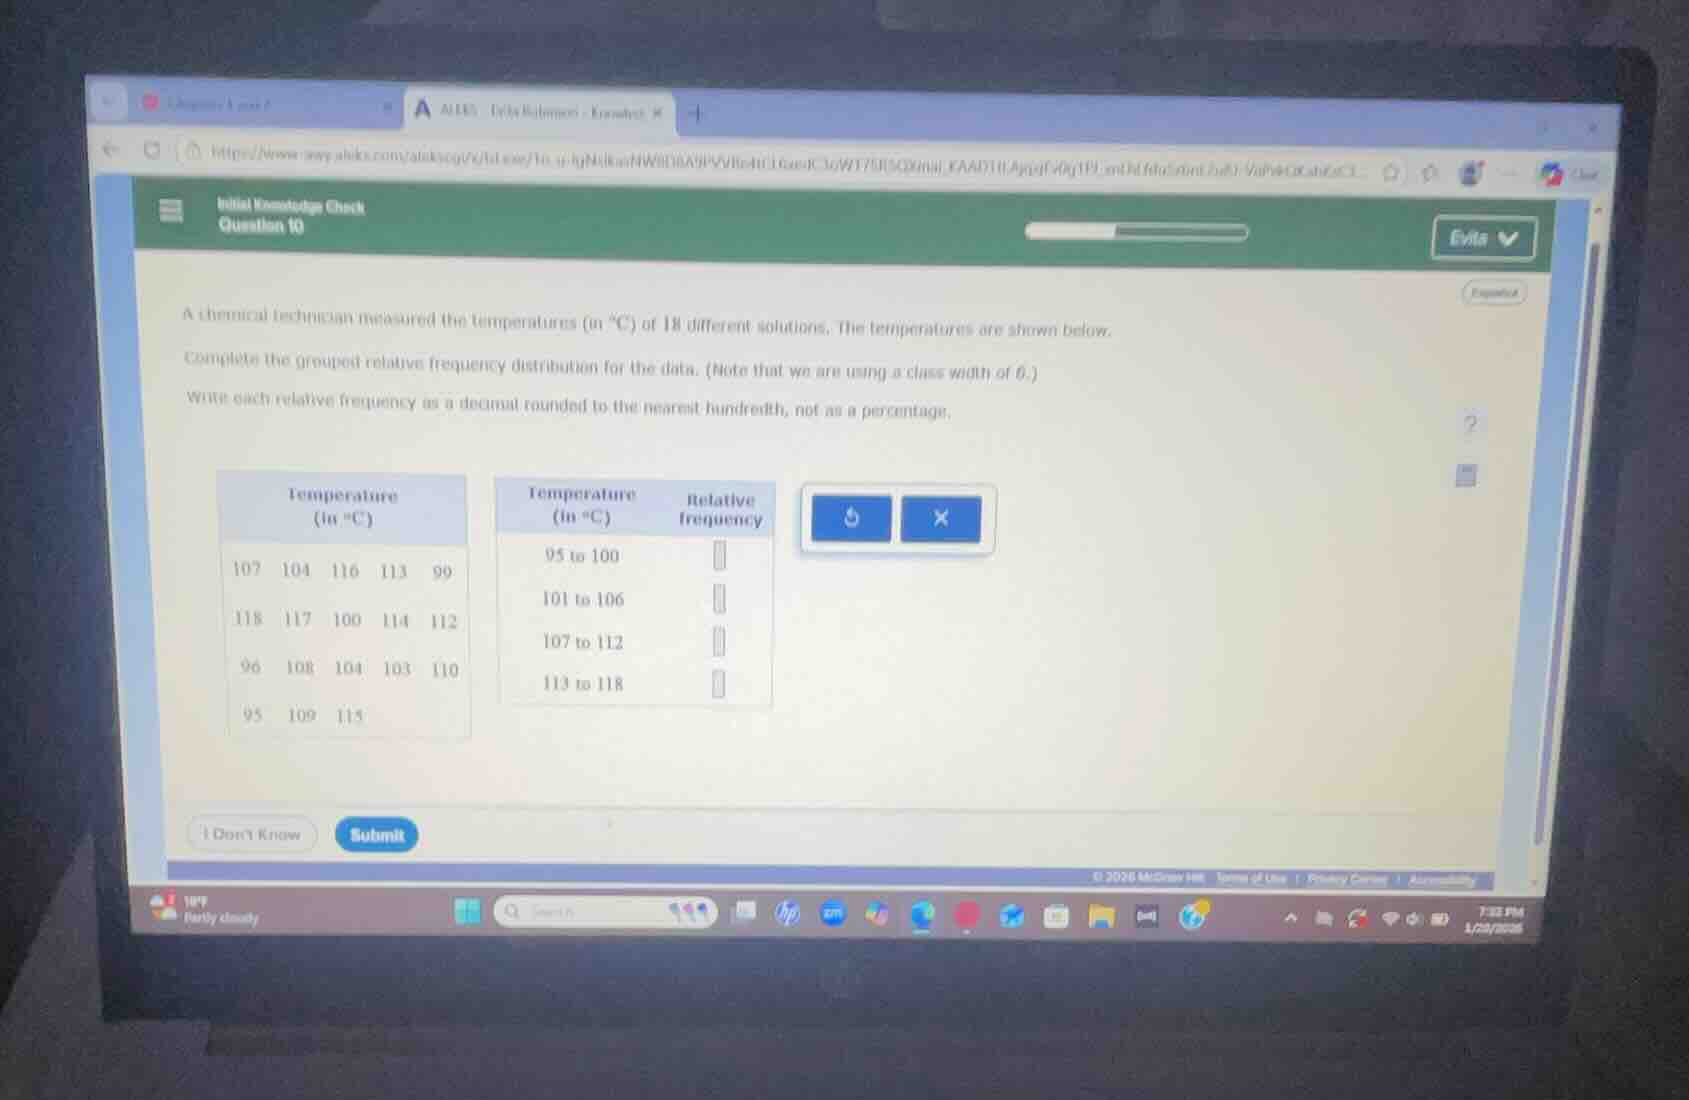
a chemical technician measured the temperatures (in °c) of 18 different solutions. the temperatures are shown below.
complete the grouped relative frequency distribution for the data. (note that we are using a class width of 6.)
write each relative frequency as a decimal rounded to the nearest hundredth, not as a percentage.
temperature (in °c)
107 104 116 113 99
118 117 100 114 112
96 108 104 103 110
95 109 115
temperature (in °c) | relative frequency
95 to 100 |
101 to 106 |
107 to 112 |
113 to 118 |
Step1: Count total data points
Total data points: $18$
Step2: Count values in 95-100
Values: 99, 100, 96, 95 → Count = $4$
Relative frequency: $\frac{4}{18} \approx 0.22$
Step3: Count values in 101-106
Values: 104, 104, 103 → Count = $3$
Relative frequency: $\frac{3}{18} \approx 0.17$
Step4: Count values in 107-112
Values: 107, 112, 108, 109, 110 → Count = $5$
Relative frequency: $\frac{5}{18} \approx 0.28$
Step5: Count values in 113-118
Values: 116, 113, 118, 117, 114, 115 → Count = $6$
Relative frequency: $\frac{6}{18} \approx 0.33$

Snap & solve any problem in the app
Get step-by-step solutions on Sovi AI
Photo-based solutions with guided steps
Explore more problems and detailed explanations
| Temperature (in °C) | Relative Frequency |
|---|---|
| 101 to 106 | 0.17 |
| 107 to 112 | 0.28 |
| 113 to 118 | 0.33 |