QUESTION IMAGE
Question
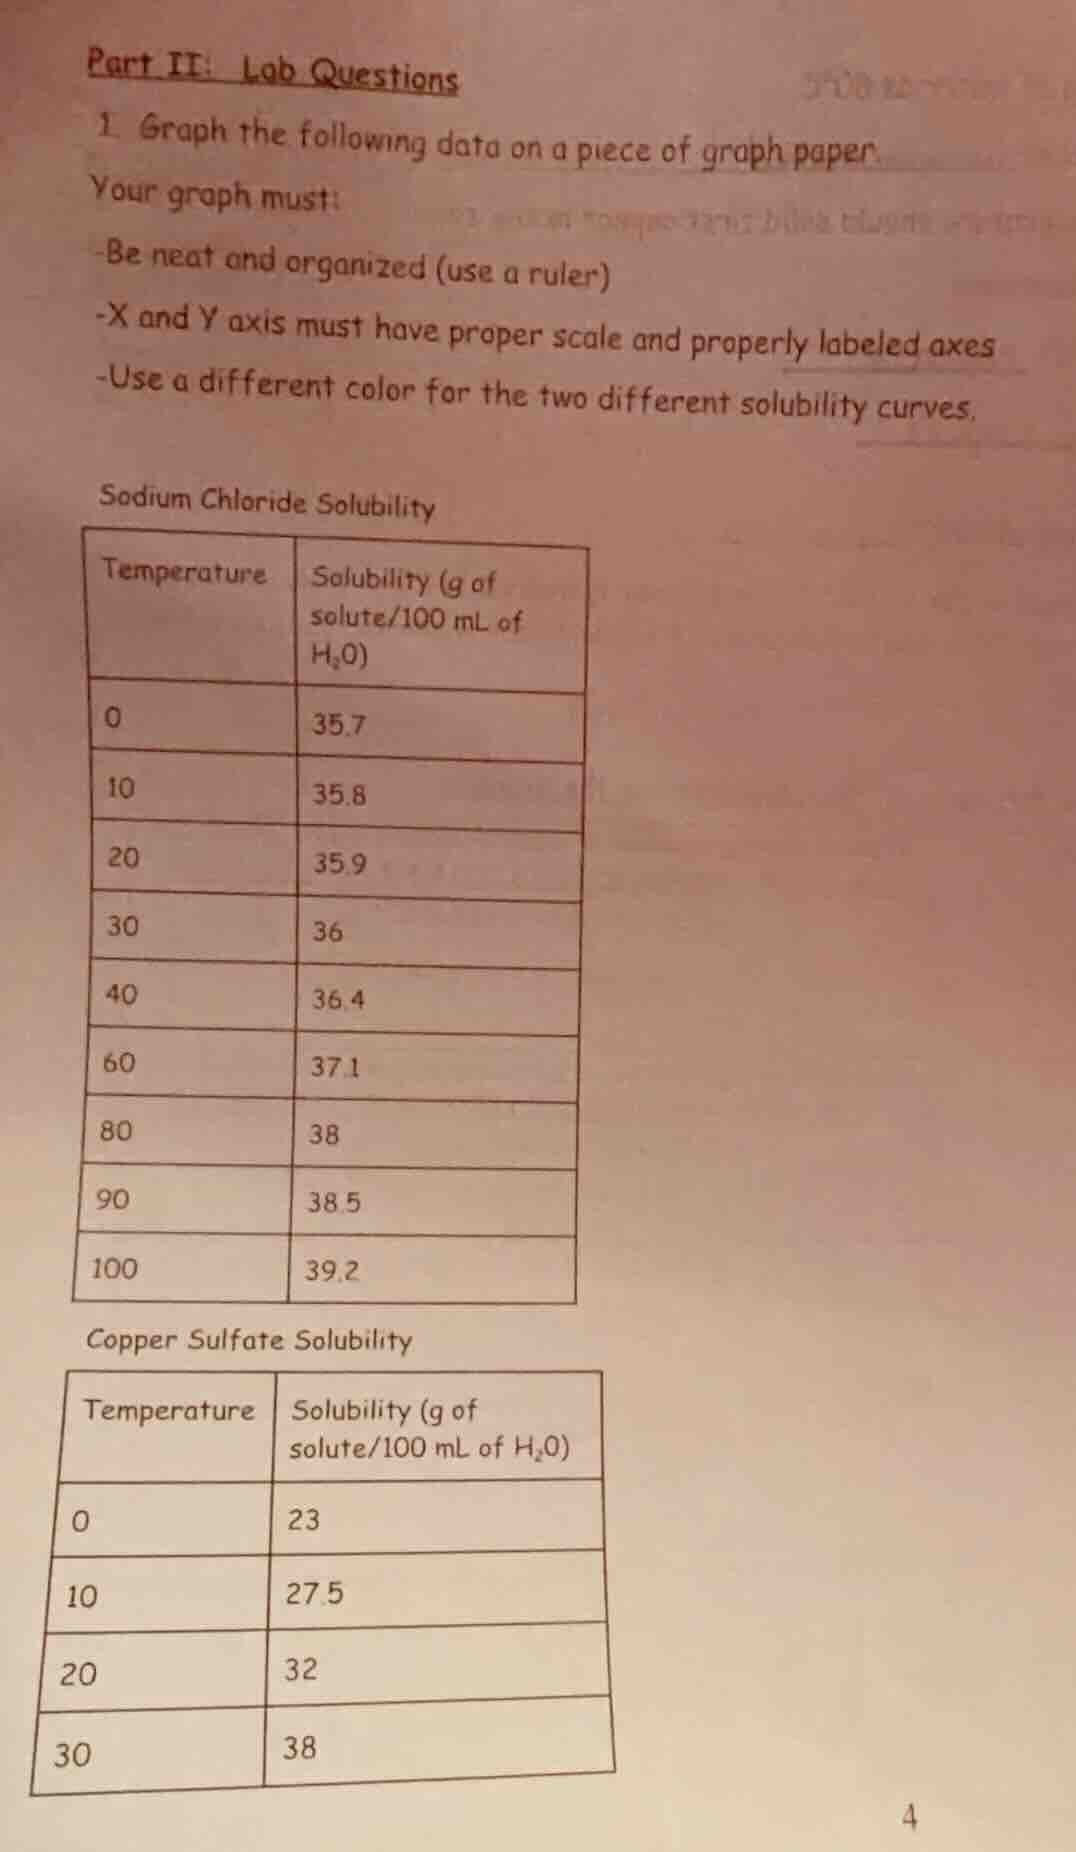
part ii: lab questions
- graph the following data on a piece of graph paper.
your graph must:
-be neat and organized (use a ruler)
-x and y axis must have proper scale and properly labeled axes
-use a different color for the two different solubility curves.
sodium chloride solubility
| temperature | solubility (g of solute/100 ml of h₂o) |
|---|---|
| 10 | 35.8 |
| 20 | 35.9 |
| 30 | 36 |
| 40 | 36.4 |
| 60 | 37.1 |
| 80 | 38 |
| 90 | 38.5 |
| 100 | 39.2 |
copper sulfate solubility
| temperature | solubility (g of solute/100 ml of h₂o) |
|---|---|
| 10 | 27.5 |
| 20 | 32 |
| 30 | 38 |
Step 1: Prepare Graph Paper and Axes
- Select a piece of graph paper. Draw the X - axis (horizontal) and Y - axis (vertical) using a ruler. Label the X - axis as "Temperature (°C)" and the Y - axis as "Solubility (g of solute/100 mL of \(H_2O\))".
- Determine the scale for the axes. For the X - axis, since the temperature values range from 0 to 100, we can use a scale of 10 units per major grid line (e.g., 0, 10, 20, ..., 100). For the Y - axis, the solubility values range from approximately 23 to 39.2, so we can use a scale of 2 or 5 units per major grid line (e.g., 20, 25, 30, 35, 40).
Step 2: Plot Sodium Chloride Data Points
- For each temperature - solubility pair in the Sodium Chloride Solubility table:
- At \(T = 0^{\circ}C\), \(S=35.7\) g/100 mL \(H_2O\). Find the position on the X - axis corresponding to \(0^{\circ}C\) and the position on the Y - axis corresponding to 35.7 g/100 mL \(H_2O\), and mark the point.
- Repeat this process for \(T = 10^{\circ}C\) (\(S = 35.8\)), \(T = 20^{\circ}C\) (\(S = 35.9\)), \(T = 30^{\circ}C\) (\(S = 36\)), \(T = 40^{\circ}C\) (\(S = 36.4\)), \(T = 60^{\circ}C\) (\(S = 37.1\)), \(T = 80^{\circ}C\) (\(S = 38\)), \(T = 90^{\circ}C\) (\(S = 38.5\)), and \(T = 100^{\circ}C\) (\(S = 39.2\)).
Step 3: Plot Copper Sulfate Data Points
- For each temperature - solubility pair in the Copper Sulfate Solubility table:
- At \(T = 0^{\circ}C\), \(S = 23\) g/100 mL \(H_2O\). Mark the point corresponding to \(0^{\circ}C\) on the X - axis and 23 g/100 mL \(H_2O\) on the Y - axis.
- Repeat for \(T = 10^{\circ}C\) (\(S = 27.5\)), \(T = 20^{\circ}C\) (\(S = 32\)), and \(T = 30^{\circ}C\) (\(S = 38\)).
Step 4: Draw Solubility Curves
- For Sodium Chloride, use one color (e.g., blue) to connect the plotted points in a smooth curve.
- For Copper Sulfate, use a different color (e.g., red) to connect its plotted points in a smooth curve. Make sure the curves are neat and follow the general trend of the data points.

Snap & solve any problem in the app
Get step-by-step solutions on Sovi AI
Photo-based solutions with guided steps
Explore more problems and detailed explanations
The graph is drawn by following the above steps, with properly labeled axes, appropriate scales, and two solubility curves (one for Sodium Chloride and one for Copper Sulfate) drawn in different colors, and the points plotted accurately. (Note: Since this is a graph - drawing task, the final answer is the completed graph as per the instructions.)