QUESTION IMAGE
Question
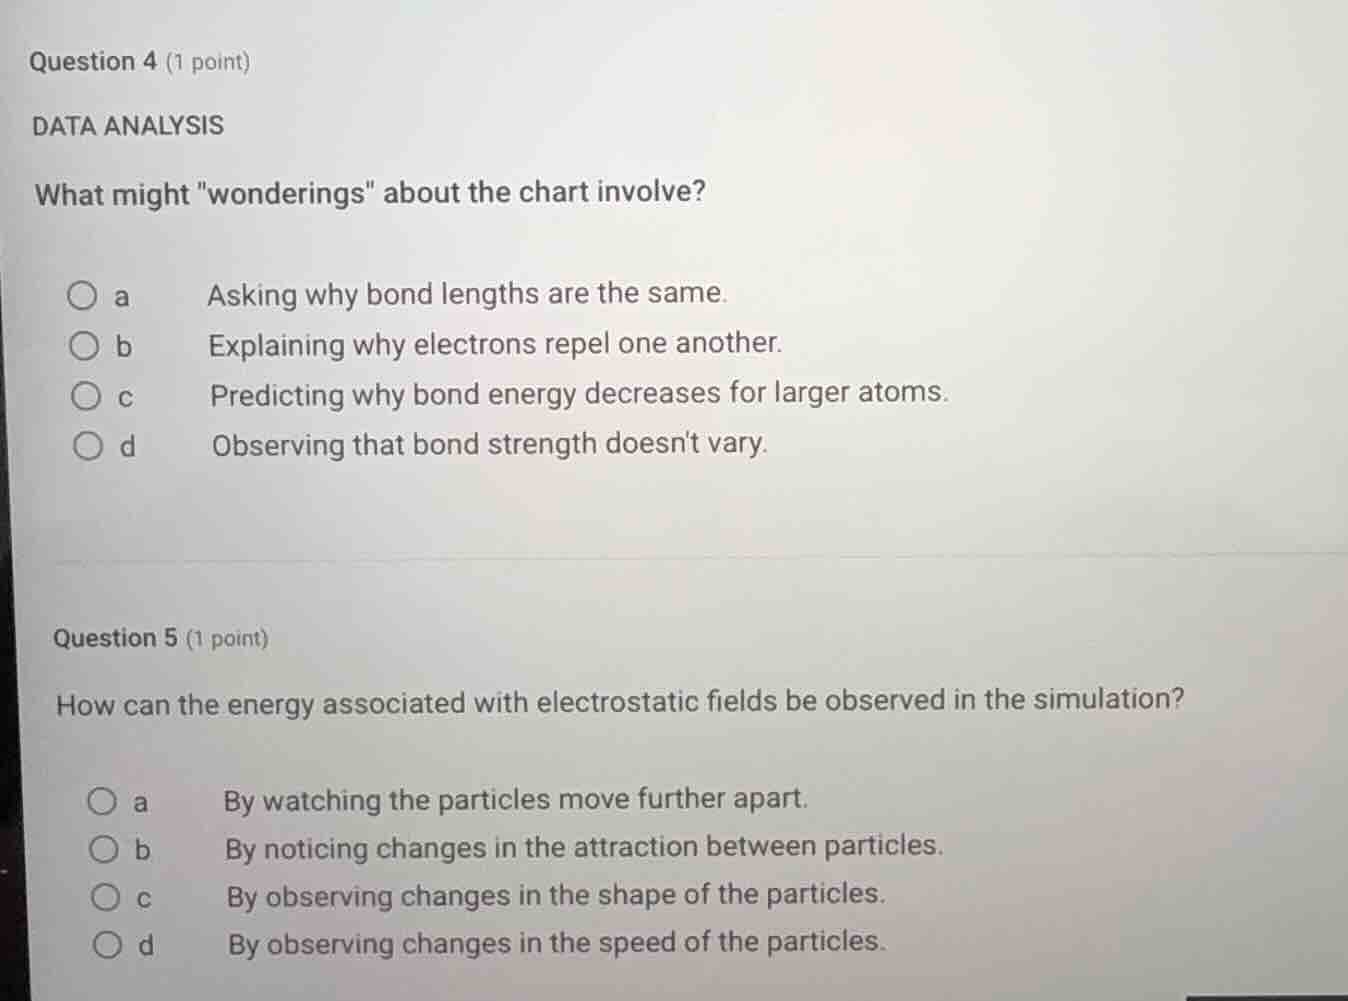
question 4 (1 point)
data analysis
what might \wanderings\ about the chart involve?
a asking why bond lengths are the same.
b explaining why electrons repel one another.
c predicting why bond energy decreases for larger atoms.
d observing that bond strength doesnt vary.
question 5 (1 point)
how can the energy associated with electrostatic fields be observed in the simulation?
a by watching the particles move further apart.
b by noticing changes in the attraction between particles.
c by observing changes in the shape of the particles.
d by observing changes in the speed of the particles.
Question 4
"Wonderings" refer to curious, exploratory questions about a chart's data/trends. Option a is incorrect because bond lengths vary by atom size. Option b is a fixed scientific fact, not a chart-related wonder. Option d is false, as bond strength does vary. Option c is a curious, predictive question about a trend that would be shown in a chart of bond energy vs atom size.
Electrostatic field energy converts to kinetic energy in particle interactions. When electrostatic forces act, particle speed changes reflect this energy transfer. Options a, b, c do not directly observe the energy associated with electrostatic fields; speed changes directly show kinetic energy changes linked to electrostatic potential energy.

Snap & solve any problem in the app
Get step-by-step solutions on Sovi AI
Photo-based solutions with guided steps
Explore more problems and detailed explanations
c. Predicting why bond energy decreases for larger atoms.
---