QUESTION IMAGE
Question
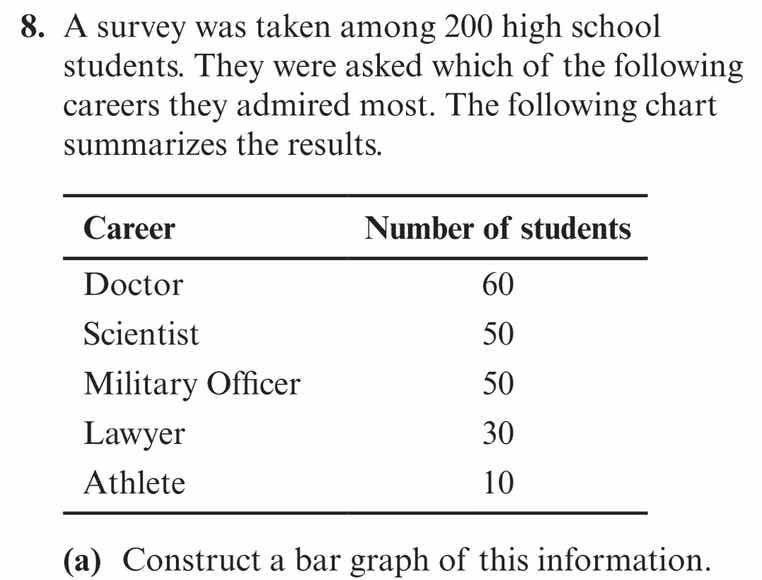
- a survey was taken among 200 high school students. they were asked which of the following careers they admired most. the following chart summarizes the results.
| career | number of students |
|---|---|
| scientist | 50 |
| military officer | 50 |
| lawyer | 30 |
| athlete | 10 |
(a) construct a bar graph of this information.
Step1: Determine Axes
- X - axis: List the careers (Doctor, Scientist, Military Officer, Lawyer, Athlete).
- Y - axis: Represent the number of students, with a scale (e.g., 0 to 70, increment of 10, since the maximum number of students for a career is 60).
Step2: Draw Bars
- For "Doctor", draw a bar reaching up to 60 on the Y - axis.
- For "Scientist", draw a bar reaching up to 50.
- For "Military Officer", draw a bar reaching up to 50 (same height as Scientist, since they have the same number of students).
- For "Lawyer", draw a bar reaching up to 30.
- For "Athlete", draw a bar reaching up to 10.
Step3: Label the Graph
- Title the bar graph: "Careers Admired Most by High School Students".
- Label the X - axis: "Career".
- Label the Y - axis: "Number of Students".
(Note: Since this is a text - based description, a visual bar graph would have rectangular bars for each career with the appropriate heights as described above. If creating a digital or hand - drawn graph, use the above steps to plot the data.)

Snap & solve any problem in the app
Get step-by-step solutions on Sovi AI
Photo-based solutions with guided steps
Explore more problems and detailed explanations
To construct the bar graph:
- Axes Setup:
- Horizontal (X) Axis: Label with the careers: Doctor, Scientist, Military Officer, Lawyer, Athlete.
- Vertical (Y) Axis: Set a scale from 0 to 70 (or appropriate range) with intervals of 10, labeled "Number of Students".
- Bar Construction:
- Draw a bar for "Doctor" with a height corresponding to 60 on the Y - axis.
- Draw bars for "Scientist" and "Military Officer" with a height corresponding to 50 on the Y - axis.
- Draw a bar for "Lawyer" with a height corresponding to 30 on the Y - axis.
- Draw a bar for "Athlete" with a height corresponding to 10 on the Y - axis.
- Graph Labeling:
- Title: "Careers Admired Most by High School Students"
- X - axis label: "Career"
- Y - axis label: "Number of Students"
(For a visual representation, the bars should be rectangular, with equal width, and their heights proportional to the number of students for each career as calculated above.)