QUESTION IMAGE
Question
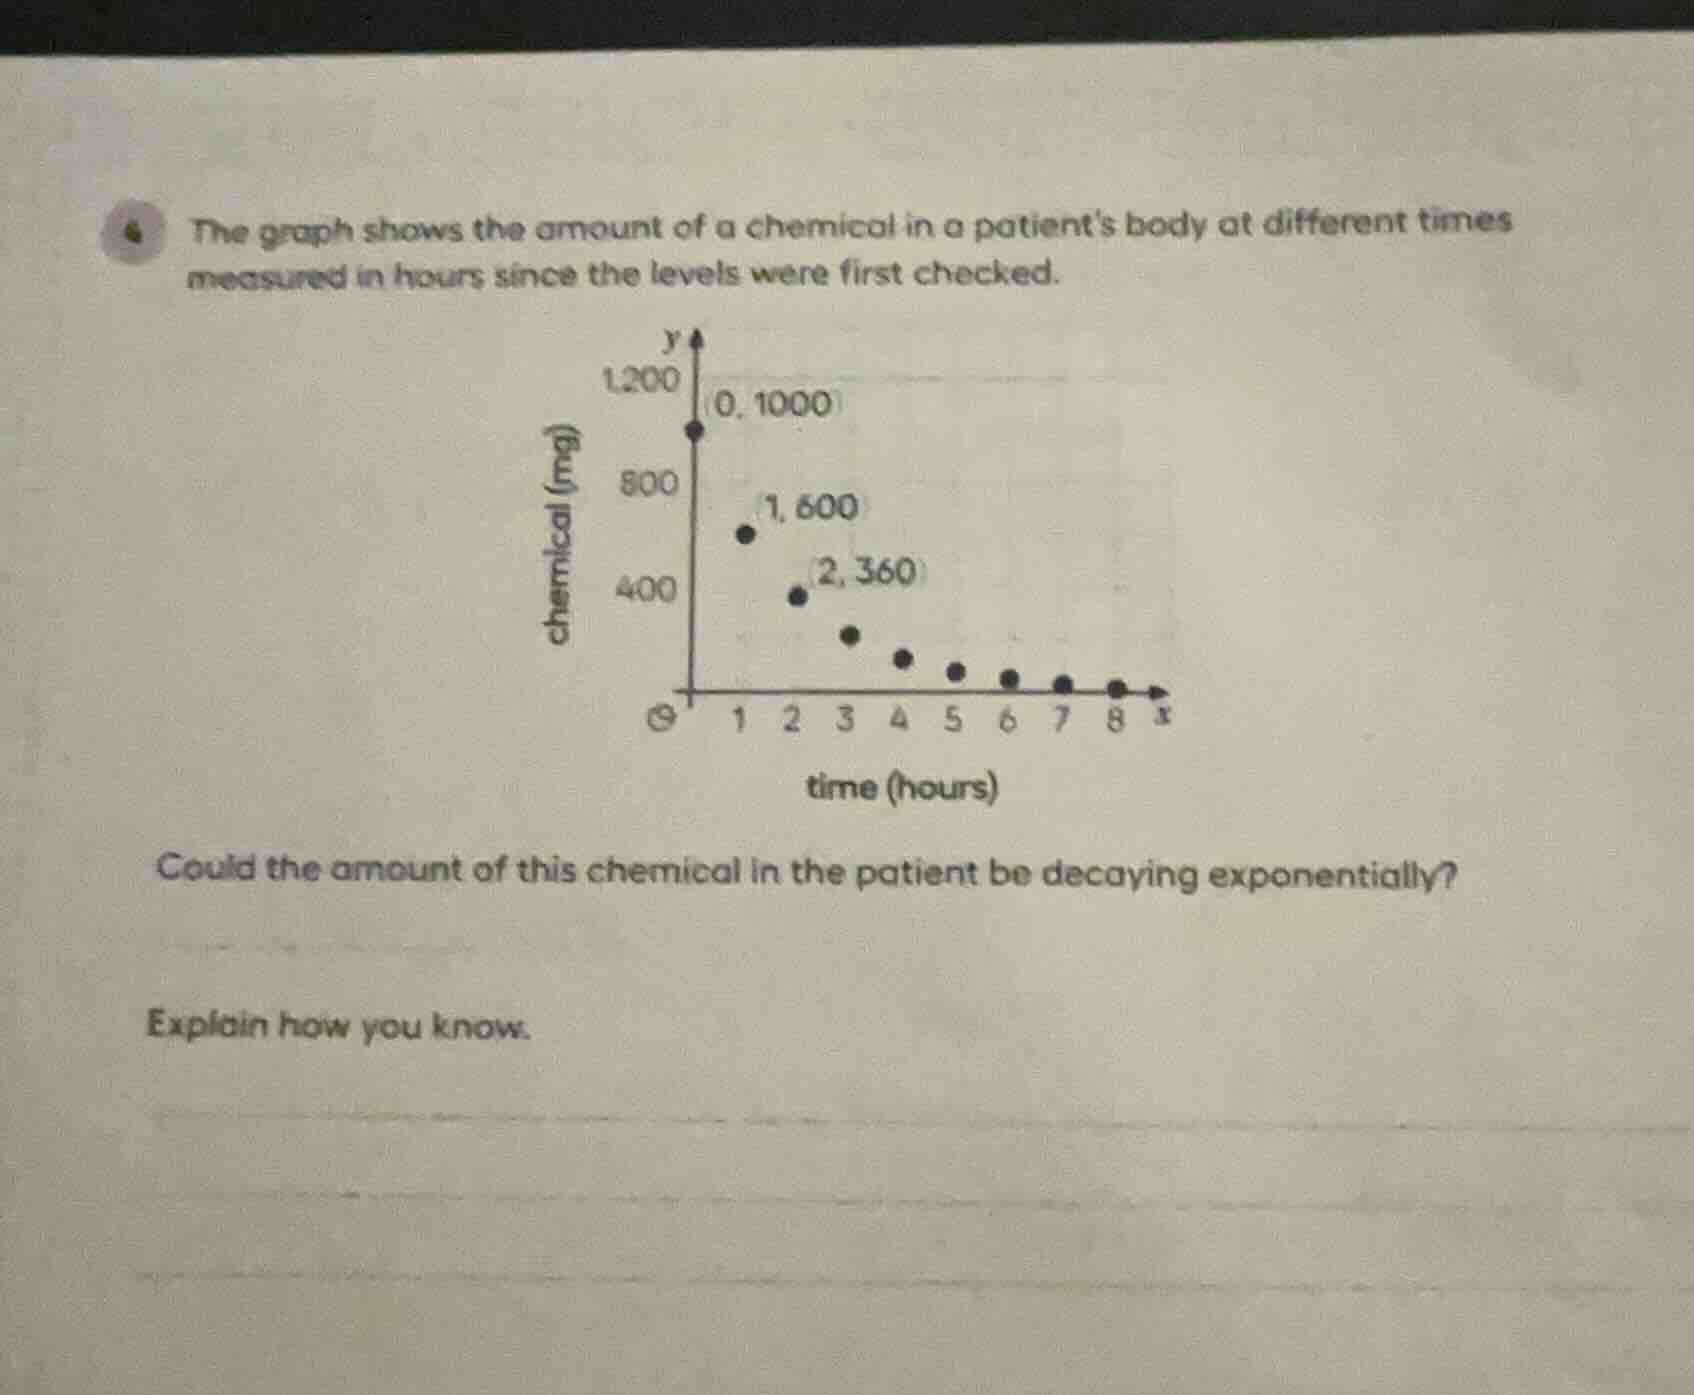
the graph shows the amount of a chemical in a patients body at different times measured in hours since the levels were first checked.
could the amount of this chemical in the patient be decaying exponentially?
explain how you know.
Exponential decay means the quantity decreases by a constant percentage factor each equal time interval. We check the ratio of consecutive values:
- From hour 0 to 1: $\frac{600}{1000} = 0.6$ (60% of the previous amount)
- From hour 1 to 2: $\frac{360}{600} = 0.6$ (again 60% of the previous amount)
The consistent multiplicative factor (0.6) per hour matches the pattern of exponential decay, where the amount is multiplied by the same ratio each time period.

Snap & solve any problem in the app
Get step-by-step solutions on Sovi AI
Photo-based solutions with guided steps
Explore more problems and detailed explanations
Yes, the chemical could be decaying exponentially. The amount of the chemical is multiplied by a constant factor of 0.6 each hour, which is the defining characteristic of exponential decay.