QUESTION IMAGE
Question
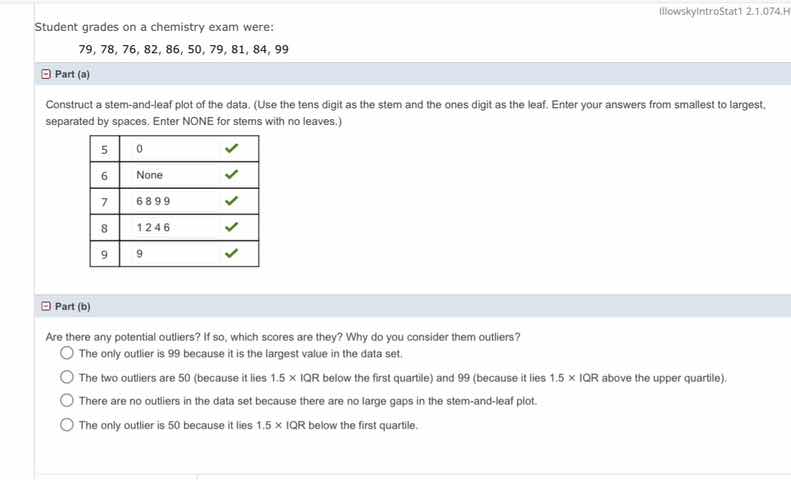
student grades on a chemistry exam were:
79, 78, 76, 82, 86, 50, 79, 81, 84, 99
part (a)
construct a stem - and - leaf plot of the data. (use the tens digit as the stem and the ones digit as the leaf. enter your answers from smallest to largest,
separated by spaces. enter none for stems with no leaves.)
5 0
6 none
7 6 8 9 9
8 1 2 4 6
9 9
part (b)
are there any potential outliers? if so, which scores are they? why do you consider them outliers?
the only outlier is 99 because it is the largest value in the data set.
the two outliers are 50 (because it lies 1.5 × iqr below the first quartile) and 99 (because it lies 1.5 × iqr above the upper quartile).
there are no outliers in the data set because there are no large gaps in the stem - and - leaf plot.
the only outlier is 50 because it lies 1.5 × iqr below the first quartile.
Part (b)
To determine outliers, we use the IQR (Interquartile Range) method. First, find the quartiles. The data set (sorted): 50, 76, 78, 79, 79, 81, 82, 84, 86, 99. Wait, no, original data: 79,78,76,82,86,50,79,81,84,99. Sorted: 50, 76, 78, 79, 79, 81, 82, 84, 86, 99.
- Q1 (first quartile): median of lower half (50,76,78,79,79) → 78.
- Q3 (third quartile): median of upper half (81,82,84,86,99) → 84.
- IQR = Q3 - Q1 = 84 - 78 = 6.
- Lower bound: Q1 - 1.5×IQR = 78 - 9 = 69.
- Upper bound: Q3 + 1.5×IQR = 84 + 9 = 93.
Now, check data points:
- 50 < 69 (lower bound) → 50 is below lower bound (1.5×IQR below Q1).
- 99 > 93 (upper bound) → 99 is above upper bound (1.5×IQR above Q3).
So both 50 and 99 are outliers as they lie 1.5×IQR below Q1 and above Q3, respectively. The second option states this.

Snap & solve any problem in the app
Get step-by-step solutions on Sovi AI
Photo-based solutions with guided steps
Explore more problems and detailed explanations
B. The two outliers are 50 (because it lies 1.5 × IQR below the first quartile) and 99 (because it lies 1.5 × IQR above the upper quartile).