QUESTION IMAGE
Question
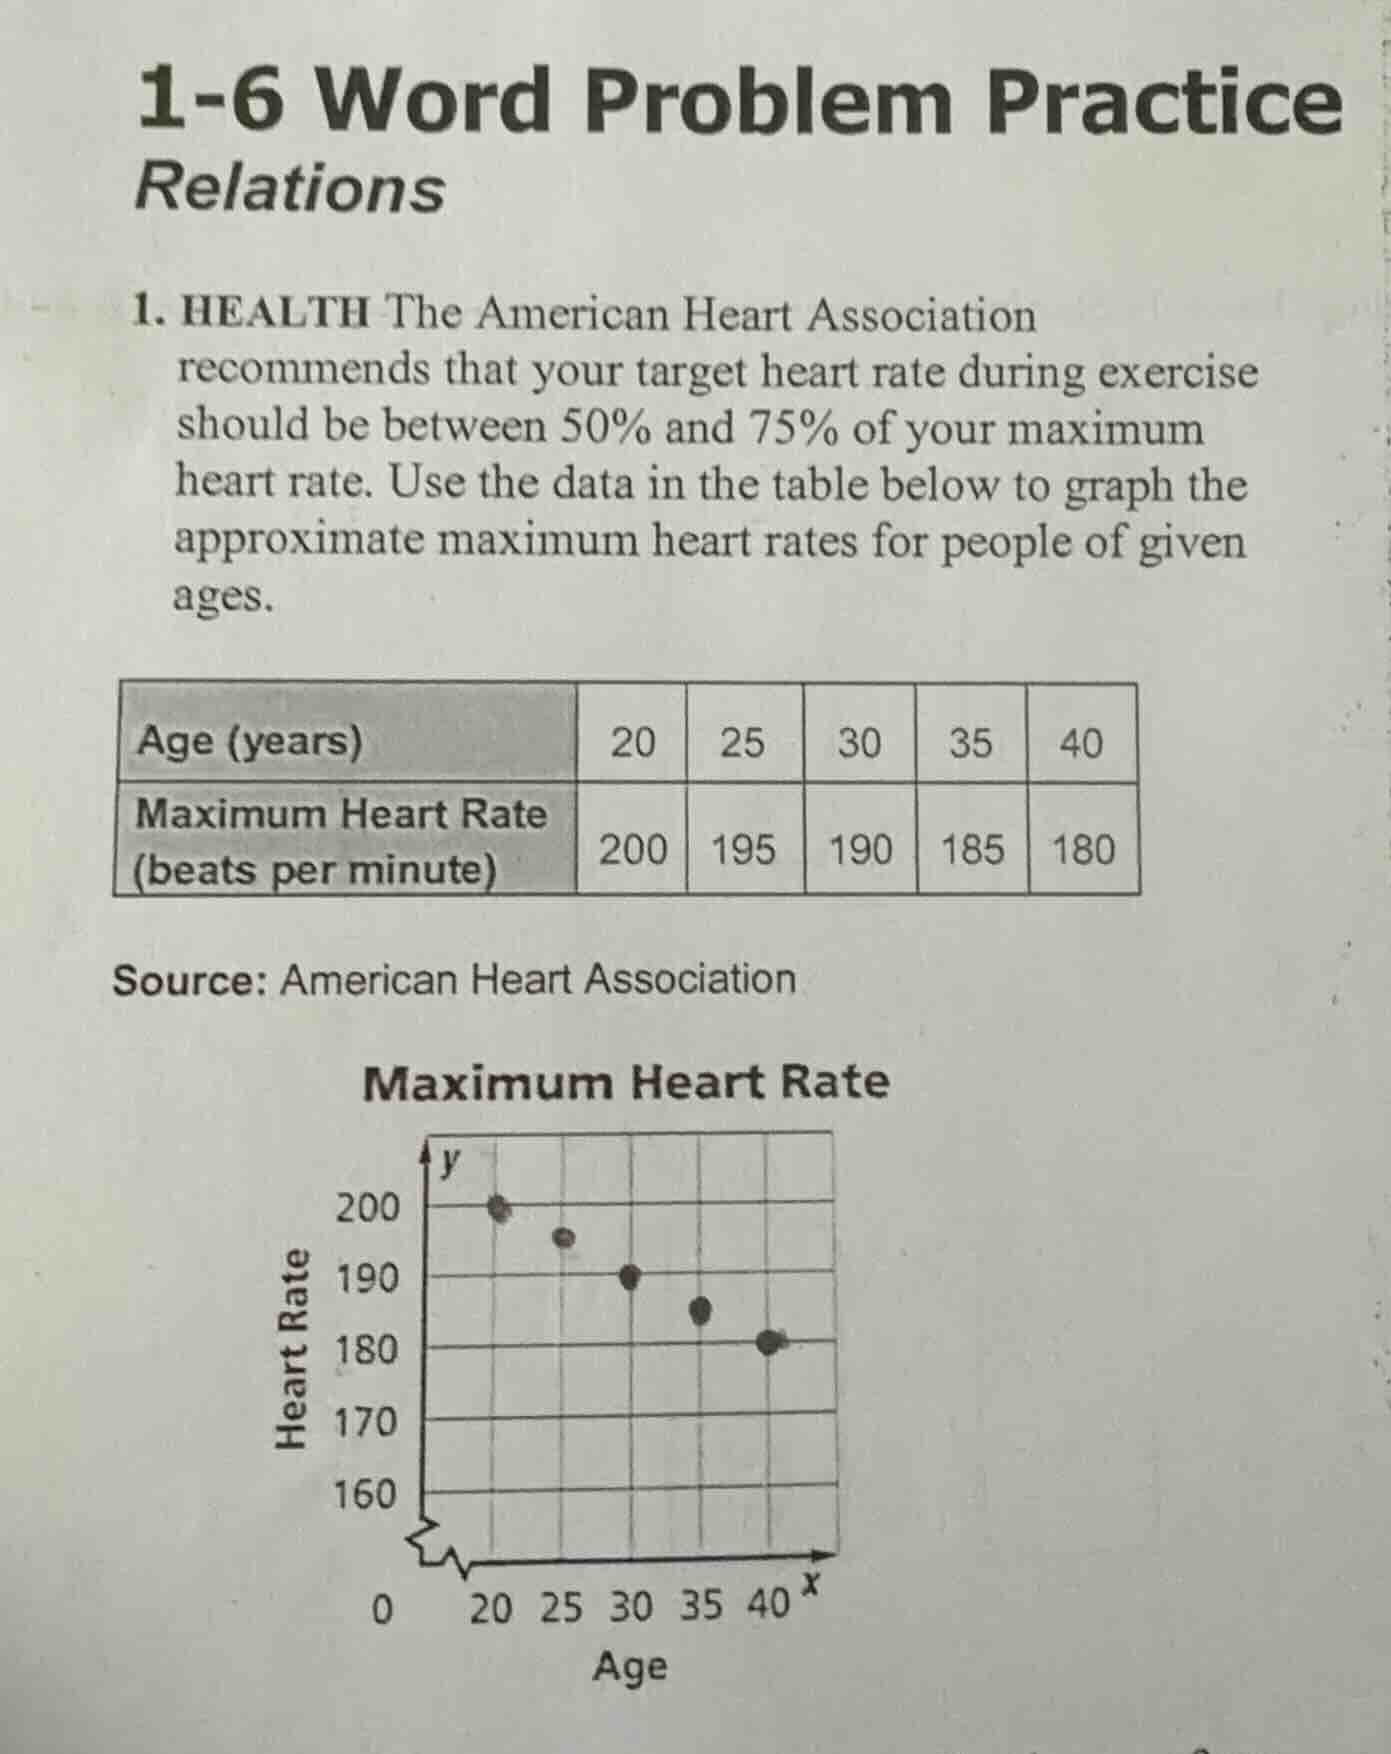
1-6 word problem practicerelations1. health the american heart associationrecommends that your target heart rate during exerciseshould be between 50% and 75% of your maximumheart rate. use the data in the table below to graph theapproximate maximum heart rates for people of givenages.age (years) | 20 | 25 | 30 | 35 | 40maximum heart rate (beats per minute) | 200 | 195 | 190 | 185 | 180source: american heart associationmaximum heart rate
Step1: Identify data points
The ordered pairs from the table are: $(20, 200)$, $(25, 195)$, $(30, 190)$, $(35, 185)$, $(40, 180)$
Step2: Verify plotted points
Check that each age (x-axis) aligns with its corresponding maximum heart rate (y-axis) on the graph:
- Age 20 lines up with 200 bpm
- Age 25 lines up with 195 bpm
- Age 30 lines up with 190 bpm
- Age 35 lines up with 185 bpm
- Age 40 lines up with 180 bpm
Step3: Confirm linear relationship
Calculate the rate of change: $\frac{\Delta y}{\Delta x} = \frac{195-200}{25-20} = \frac{-5}{5} = -1$
This constant rate confirms the points form a straight line with slope $-1$.

Snap & solve any problem in the app
Get step-by-step solutions on Sovi AI
Photo-based solutions with guided steps
Explore more problems and detailed explanations
The provided graph correctly plots the maximum heart rate data: each age (x-value) is paired with its corresponding maximum heart rate (y-value) as given in the table, forming a linear relationship where maximum heart rate decreases by 1 beat per minute for each 1-year increase in age.