QUESTION IMAGE
Question
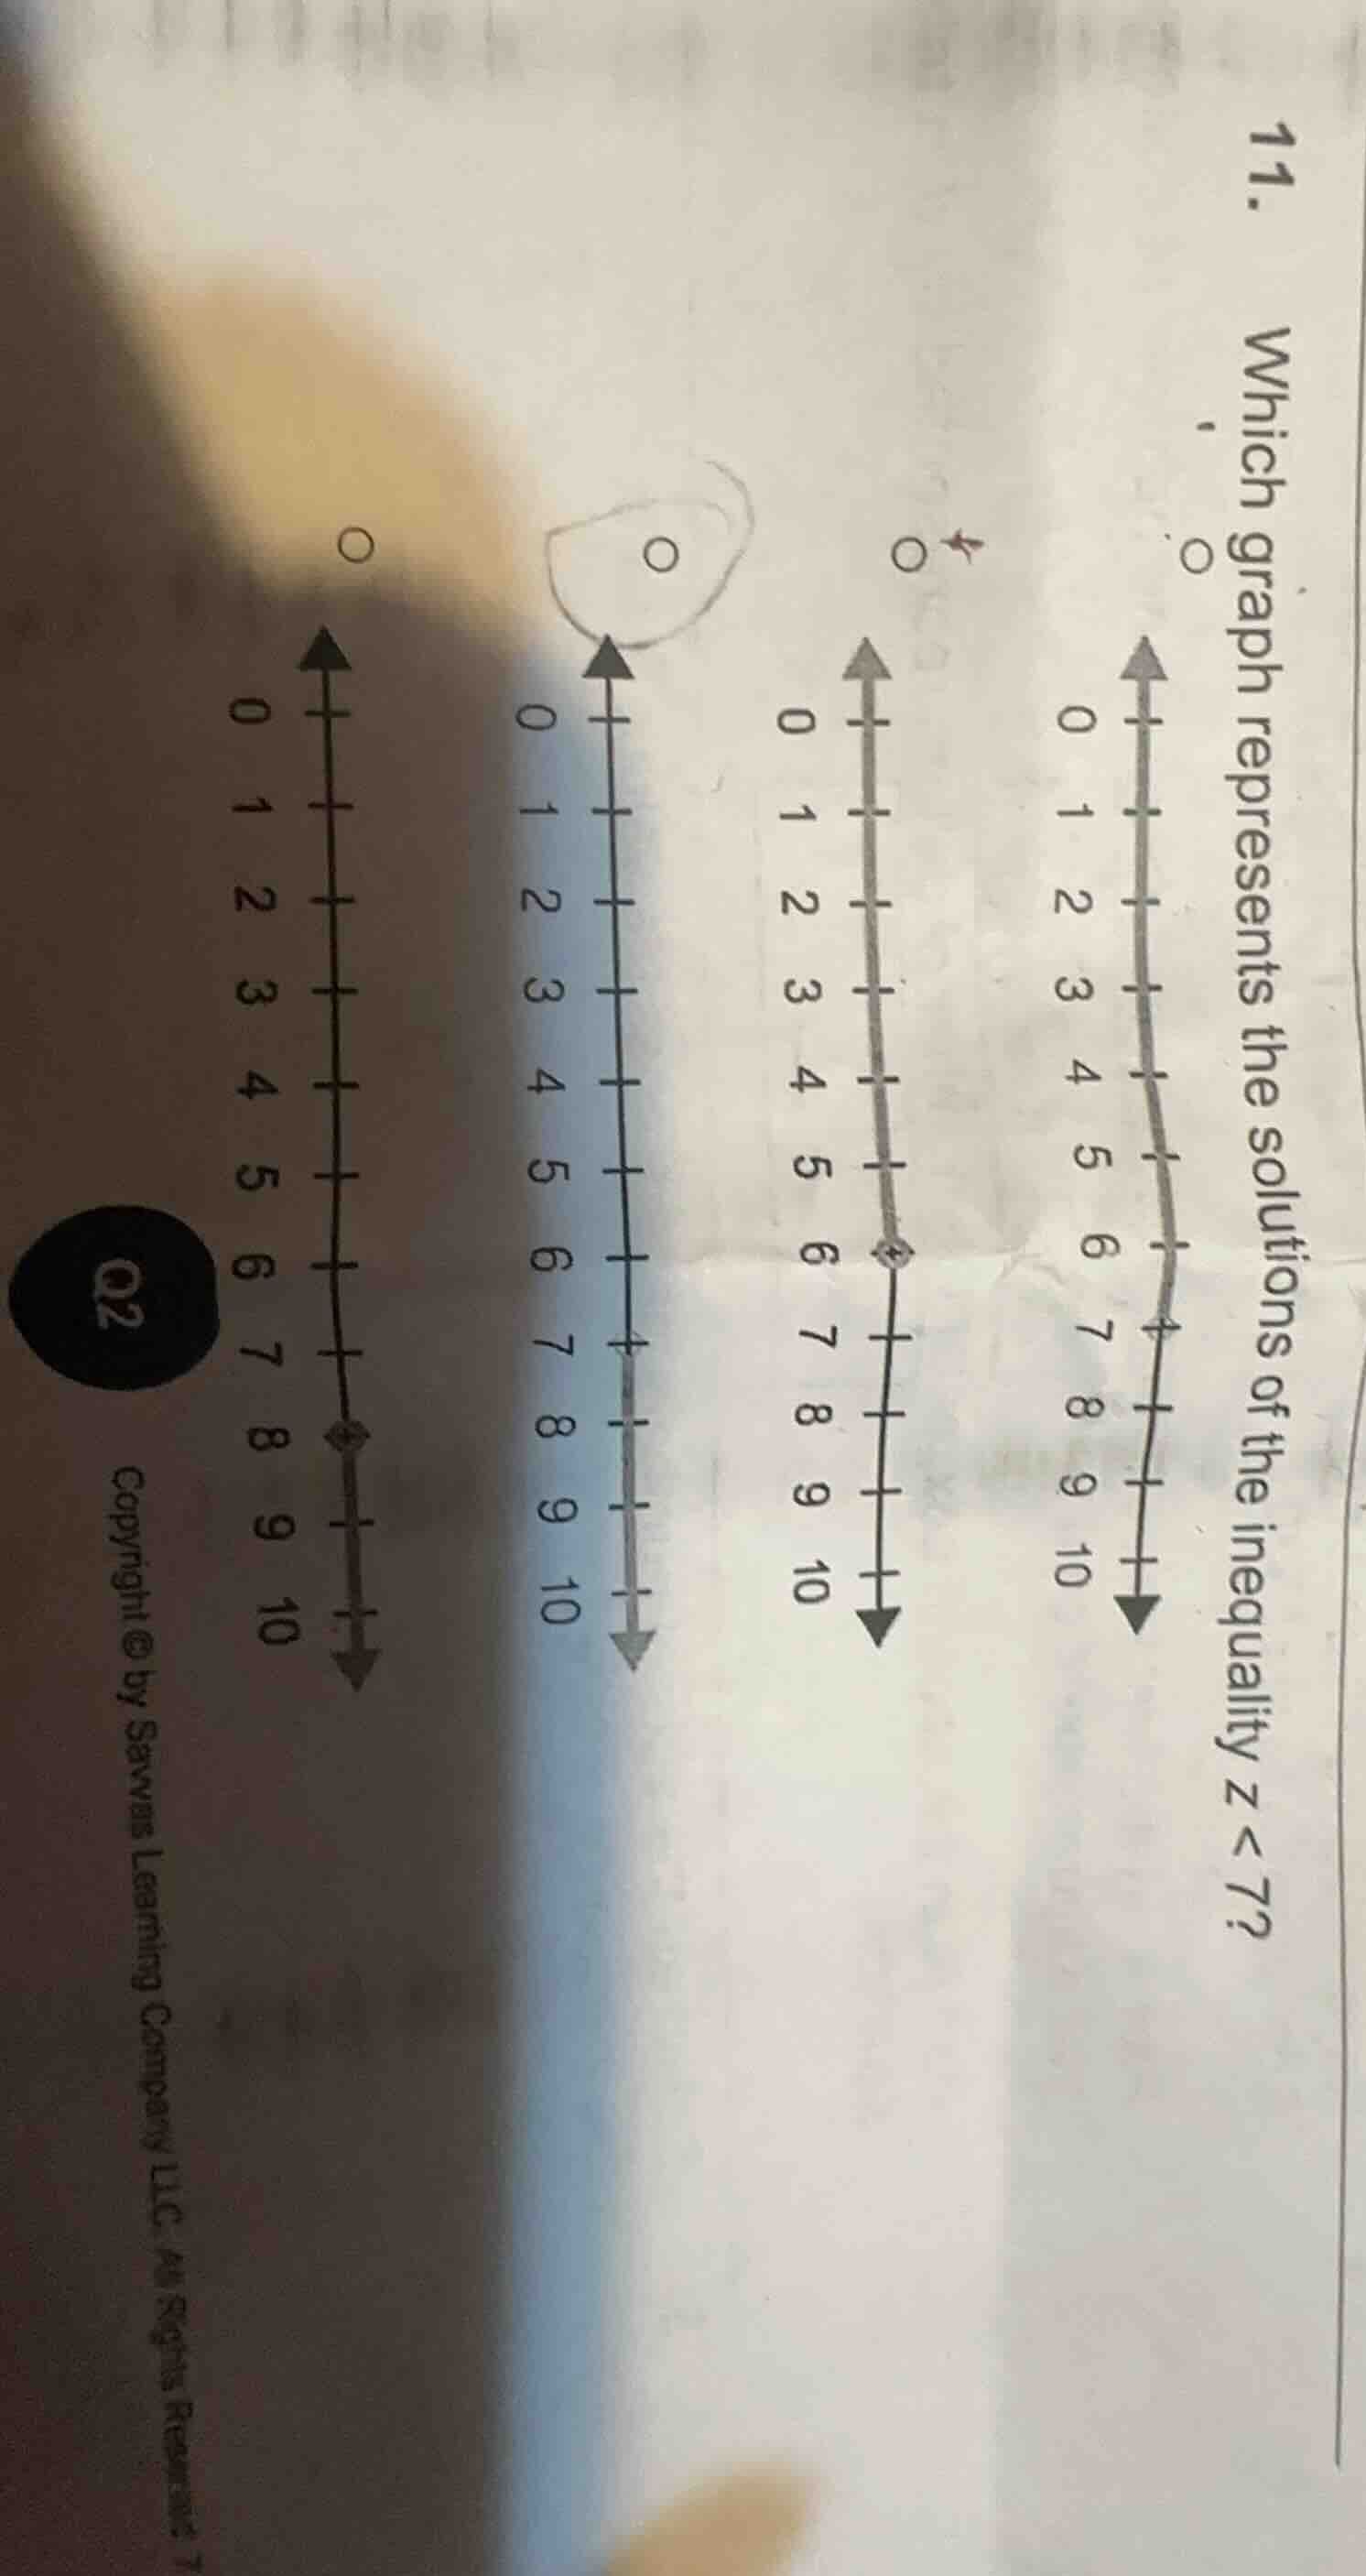
- which graph represents the solutions of the inequality z < 7? copyright © savvas learning company llc all rights reserved.
Step1: Analyze inequality $z<7$
The inequality means all values of $z$ are less than 7. On a number line, this uses an open circle at 7 (since 7 is not included) and an arrow pointing left (towards smaller numbers).
Step2: Match to the correct graph
Compare to the options:
- First graph: Closed circle at 8, arrow right (represents $z\geq8$)
- Second graph: Open circle at 7, arrow right (represents $z>7$)
- Third graph: Open circle at 6, arrow down (represents $z<6$)
- Fourth graph: Open circle at 7, arrow left (represents $z<7$)

Snap & solve any problem in the app
Get step-by-step solutions on Sovi AI
Photo-based solutions with guided steps
Explore more problems and detailed explanations
The fourth graph (open circle at 7, arrow pointing left towards smaller numbers)