QUESTION IMAGE
Question
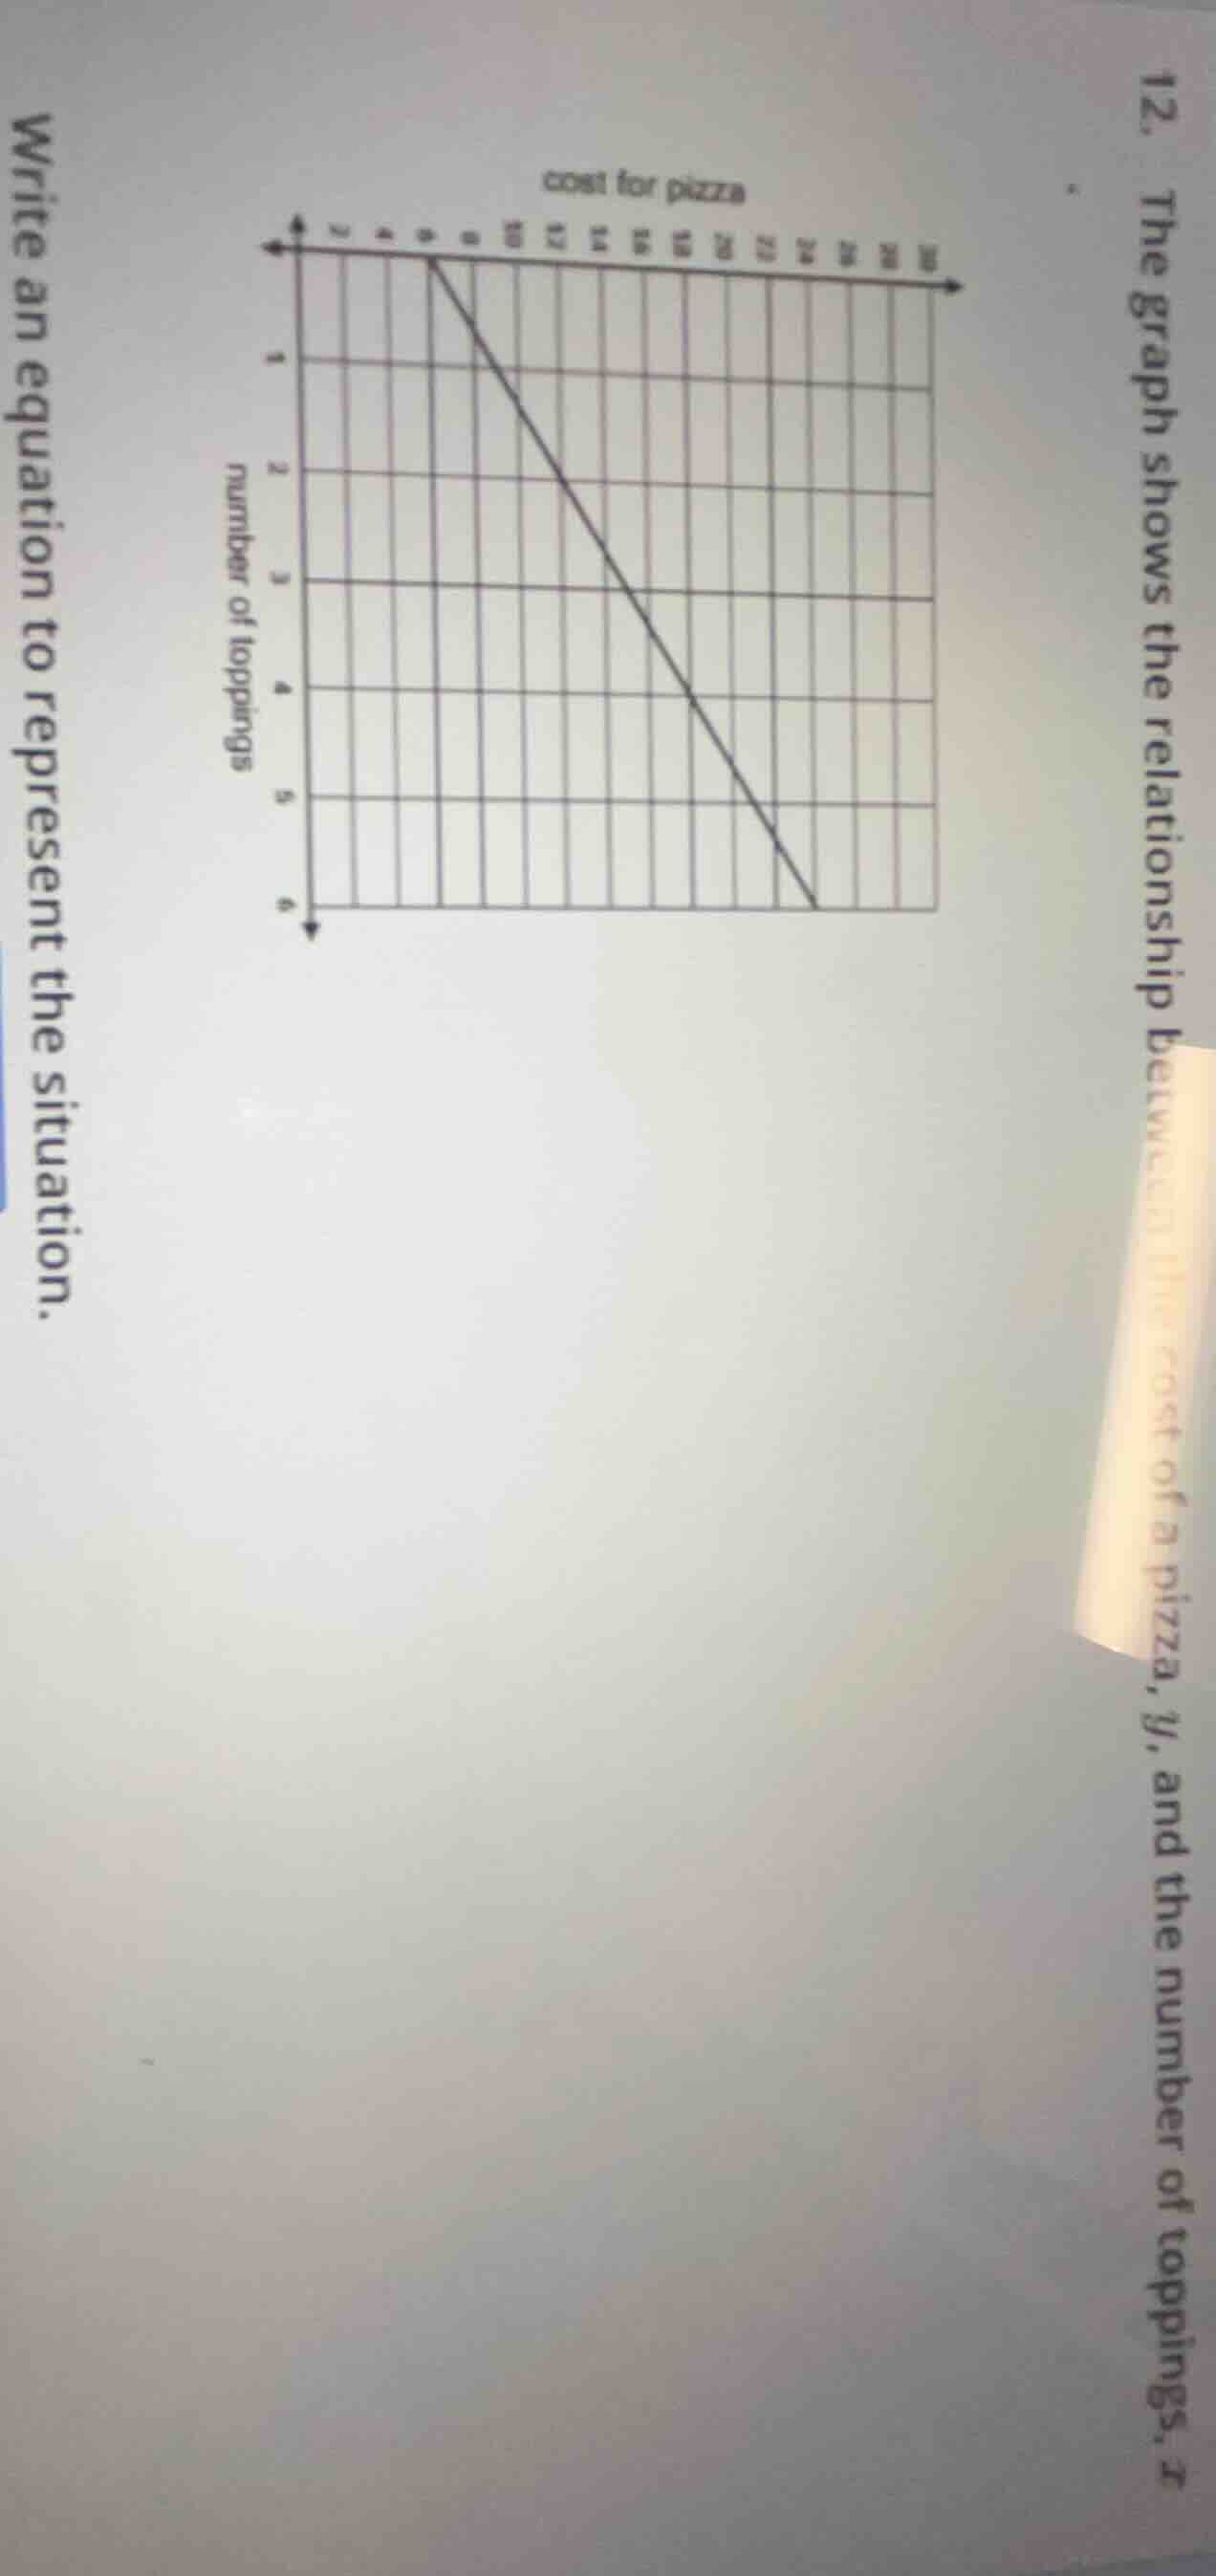
- the graph shows the relationship between the cost of a pizza, y, and the number of toppings, x. write an equation to represent the situation. graph titled cost for pizza with number of toppings on y - axis and cost (presumably) on x - axis, and a line plotted
Step1: Identify two points
From the graph, take points $(x_1,y_1)=(0,6)$ and $(x_2,y_2)=(1,8)$
Step2: Calculate slope $m$
Slope formula: $m=\frac{y_2-y_1}{x_2-x_1}$
$m=\frac{8-6}{1-0}=2$
Step3: Find y-intercept $b$
The y-intercept is the $y$-value when $x=0$, so $b=6$
Step4: Write linear equation
Use slope-intercept form $y=mx+b$
$y=2x+6$

Snap & solve any problem in the app
Get step-by-step solutions on Sovi AI
Photo-based solutions with guided steps
Explore more problems and detailed explanations
$y=2x+6$