QUESTION IMAGE
Question
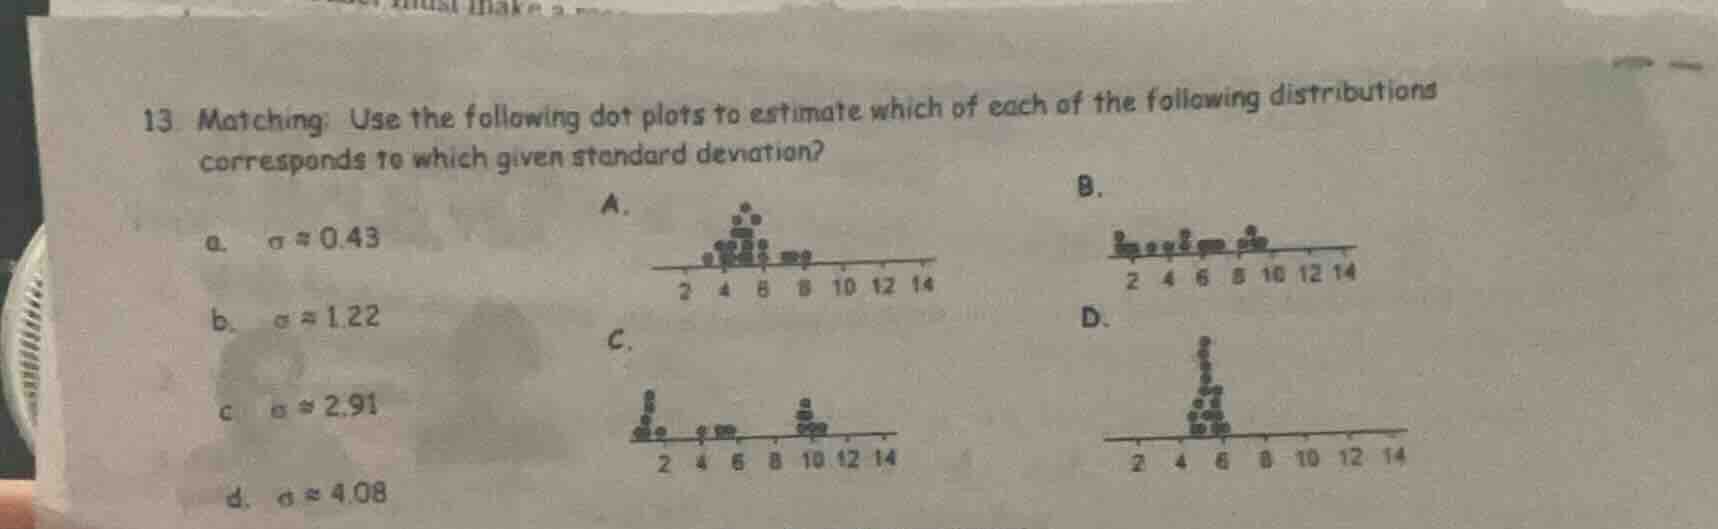
- matching: use the following dot plots to estimate which of each of the following distributions corresponds to which given standard deviation?
a. ( sigma approx 0.43 )
b. ( sigma approx 1.22 )
c. ( sigma approx 2.91 )
d. ( sigma approx 4.08 )
To solve this, we use the concept that the standard deviation (σ) measures the spread of data. A smaller σ means data is clustered tightly around the mean, while a larger σ means data is more spread out.
Step 1: Analyze each dot plot's spread
- Plot D: Data is very tightly clustered around 6. So it should have the smallest σ.
- Plot A: Data is clustered around 6 but a bit more spread than D.
- Plot B: Data is spread out more than A, with values from 2 to 10.
- Plot C: Data is in two clusters (around 2 and 10), so it's the most spread out.
Step 2: Match with σ values
- Smallest σ (≈0.43) → Tightest cluster (Plot D).
- Next (≈1.22) → Slightly spread (Plot A).
- Next (≈2.91) → More spread (Plot B).
- Largest σ (≈4.08) → Most spread (Plot C). Wait, no, let's re - check:
Wait, the σ values are a: 0.43, b:1.22, c:2.91, d:4.08.
- Plot D: Tight around 6 → σ≈0.43 (a).
- Plot A: Clustered around 6, some spread → σ≈1.22 (b).
- Plot B: Spread from 2 - 10, moderate → σ≈2.91 (c).
- Plot C: Two clusters (2 and 10), most spread → σ≈4.08 (d).

Snap & solve any problem in the app
Get step-by-step solutions on Sovi AI
Photo-based solutions with guided steps
Explore more problems and detailed explanations
a. \( \sigma \approx 0.43 \) corresponds to Plot D
b. \( \sigma \approx 1.22 \) corresponds to Plot A
c. \( \sigma \approx 2.91 \) corresponds to Plot B
d. \( \sigma \approx 4.08 \) corresponds to Plot C