QUESTION IMAGE
Question
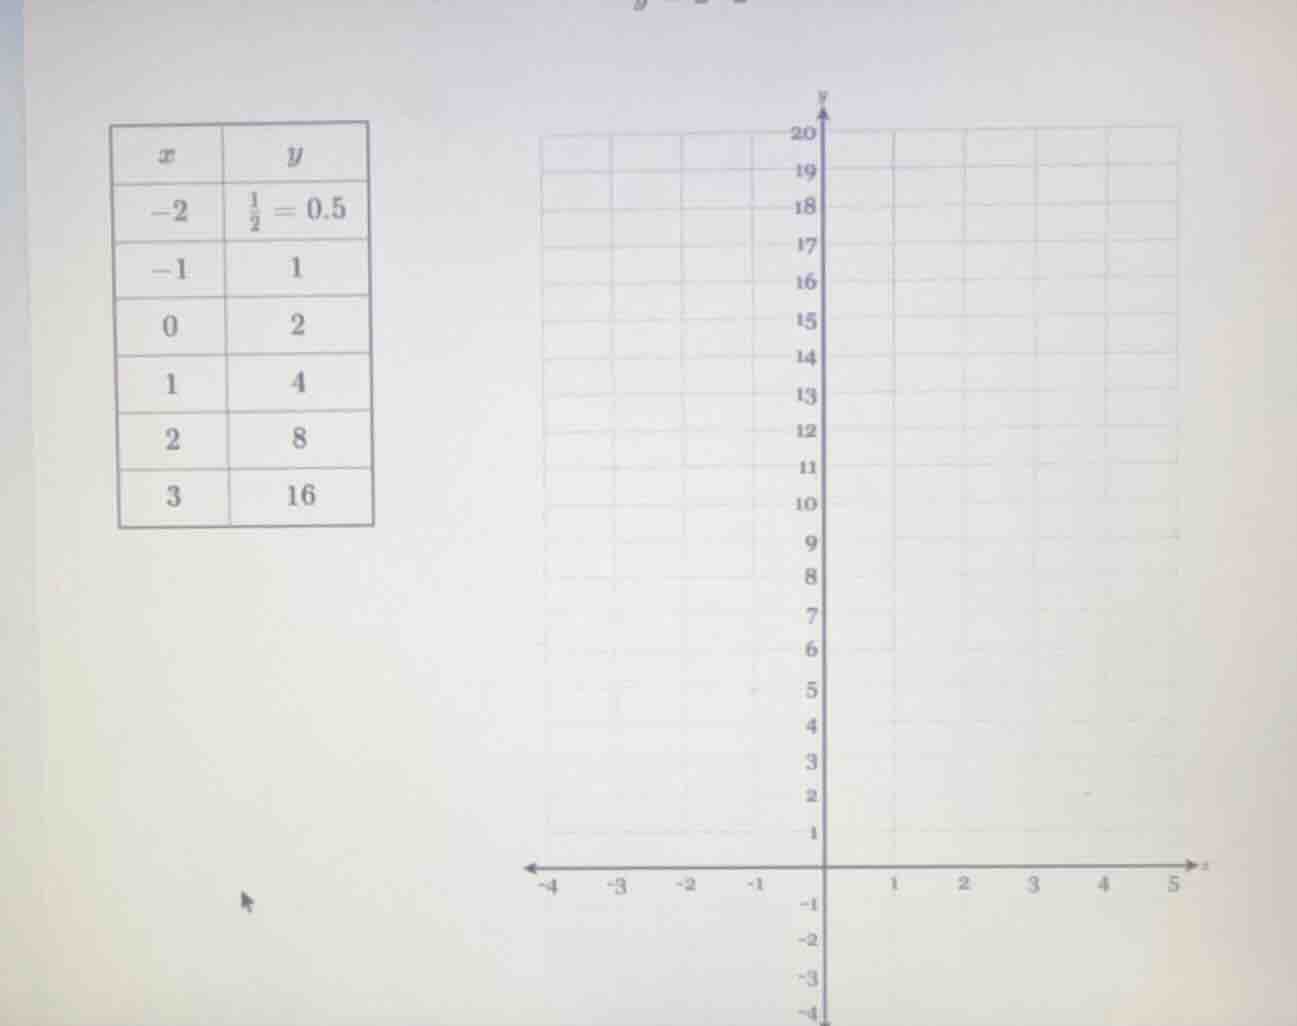
x | y
-2 | 1/2 = 0.5
-1 | 1
0 | 2
1 | 4
2 | 8
3 | 16
Step1: Identify the function
Looking at the table, when \( x = -2 \), \( y = 0.5 = 2^{-1} \); \( x = -1 \), \( y = 1 = 2^{0} \); \( x = 0 \), \( y = 2 = 2^{1} \); \( x = 1 \), \( y = 4 = 2^{2} \); \( x = 2 \), \( y = 8 = 2^{3} \); \( x = 3 \), \( y = 16 = 2^{4} \). So the function is \( y = 2^{x + 1} \) (we can check: for \( x=-2 \), \( 2^{-2 + 1}=2^{-1}=0.5 \); for \( x = -1 \), \( 2^{-1+1}=2^{0}=1 \), etc.).
Step2: Plot the points
- For \( x=-2 \), \( y = 0.5 \): plot the point \((-2, 0.5)\)
- For \( x=-1 \), \( y = 1 \): plot the point \((-1, 1)\)
- For \( x = 0 \), \( y = 2 \): plot the point \((0, 2)\)
- For \( x = 1 \), \( y = 4 \): plot the point \((1, 4)\)
- For \( x = 2 \), \( y = 8 \): plot the point \((2, 8)\)
- For \( x = 3 \), \( y = 16 \): plot the point \((3, 16)\)
Step3: Draw the curve
Connect the plotted points with a smooth curve, since it's an exponential function, the curve should show the exponential growth (for \( x\geq - 2\)) and decay (for \( x < - 2\) but in our table we have up to \( x=-2\)).

Snap & solve any problem in the app
Get step-by-step solutions on Sovi AI
Photo-based solutions with guided steps
Explore more problems and detailed explanations
The graph is plotted by first identifying the exponential function \( y = 2^{x + 1} \) from the table, then plotting the points \((-2, 0.5)\), \((-1, 1)\), \((0, 2)\), \((1, 4)\), \((2, 8)\), \((3, 16)\) and drawing a smooth curve through them.