QUESTION IMAGE
Question
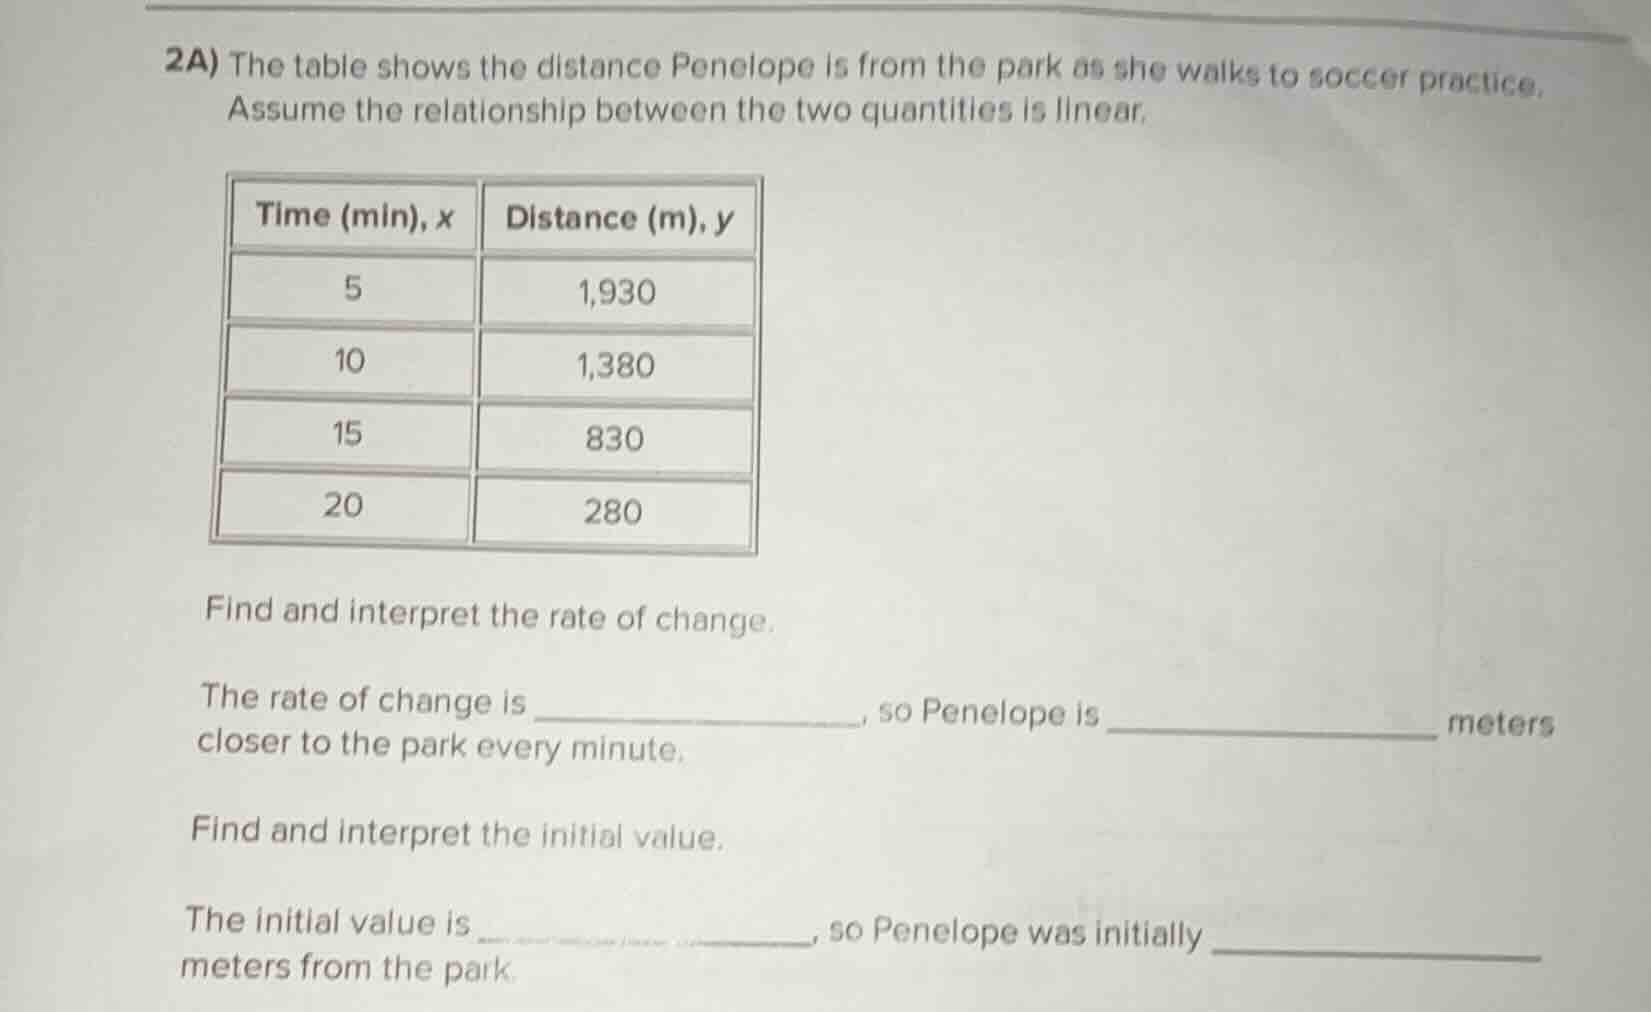
2a) the table shows the distance penelope is from the park as she walks to soccer practice. assume the relationship between the two quantities is linear.
| time (min), x | distance (m), y |
|---|---|
| 10 | 1,380 |
| 15 | 830 |
| 20 | 280 |
find and interpret the rate of change.
the rate of change is ____________, so penelope is ____________ meters closer to the park every minute.
find and interpret the initial value.
the initial value is ____________, so penelope was initially ____________ meters from the park.
Step1: Calculate rate of change
The rate of change (slope) for a linear relationship is given by $\frac{y_2 - y_1}{x_2 - x_1}$. Let's take two points, say $(5, 1930)$ and $(10, 1380)$.
$$\frac{1380 - 1930}{10 - 5} = \frac{-550}{5} = -110$$
Step2: Interpret rate of change
A negative rate of change of -110 means Penelope's distance from the park decreases by 110 meters per minute, so she is 110 meters closer every minute.
Step3: Find the linear equation
The linear equation is $y = mx + b$, where $m = -110$. Using the point $(5, 1930)$:
$$1930 = -110(5) + b$$
$$1930 = -550 + b$$
$$b = 1930 + 550 = 2480$$
Step4: Interpret initial value
The initial value is the y - intercept ($b$), which is 2480. This means initially (at $x = 0$ minutes), Penelope was 2480 meters from the park.

Snap & solve any problem in the app
Get step-by-step solutions on Sovi AI
Photo-based solutions with guided steps
Explore more problems and detailed explanations
The rate of change is $\boldsymbol{-110}$, so Penelope is $\boldsymbol{110}$ meters closer to the park every minute.
The initial value is $\boldsymbol{2480}$, so Penelope was initially $\boldsymbol{2480}$ meters from the park.