QUESTION IMAGE
Question
6-4.
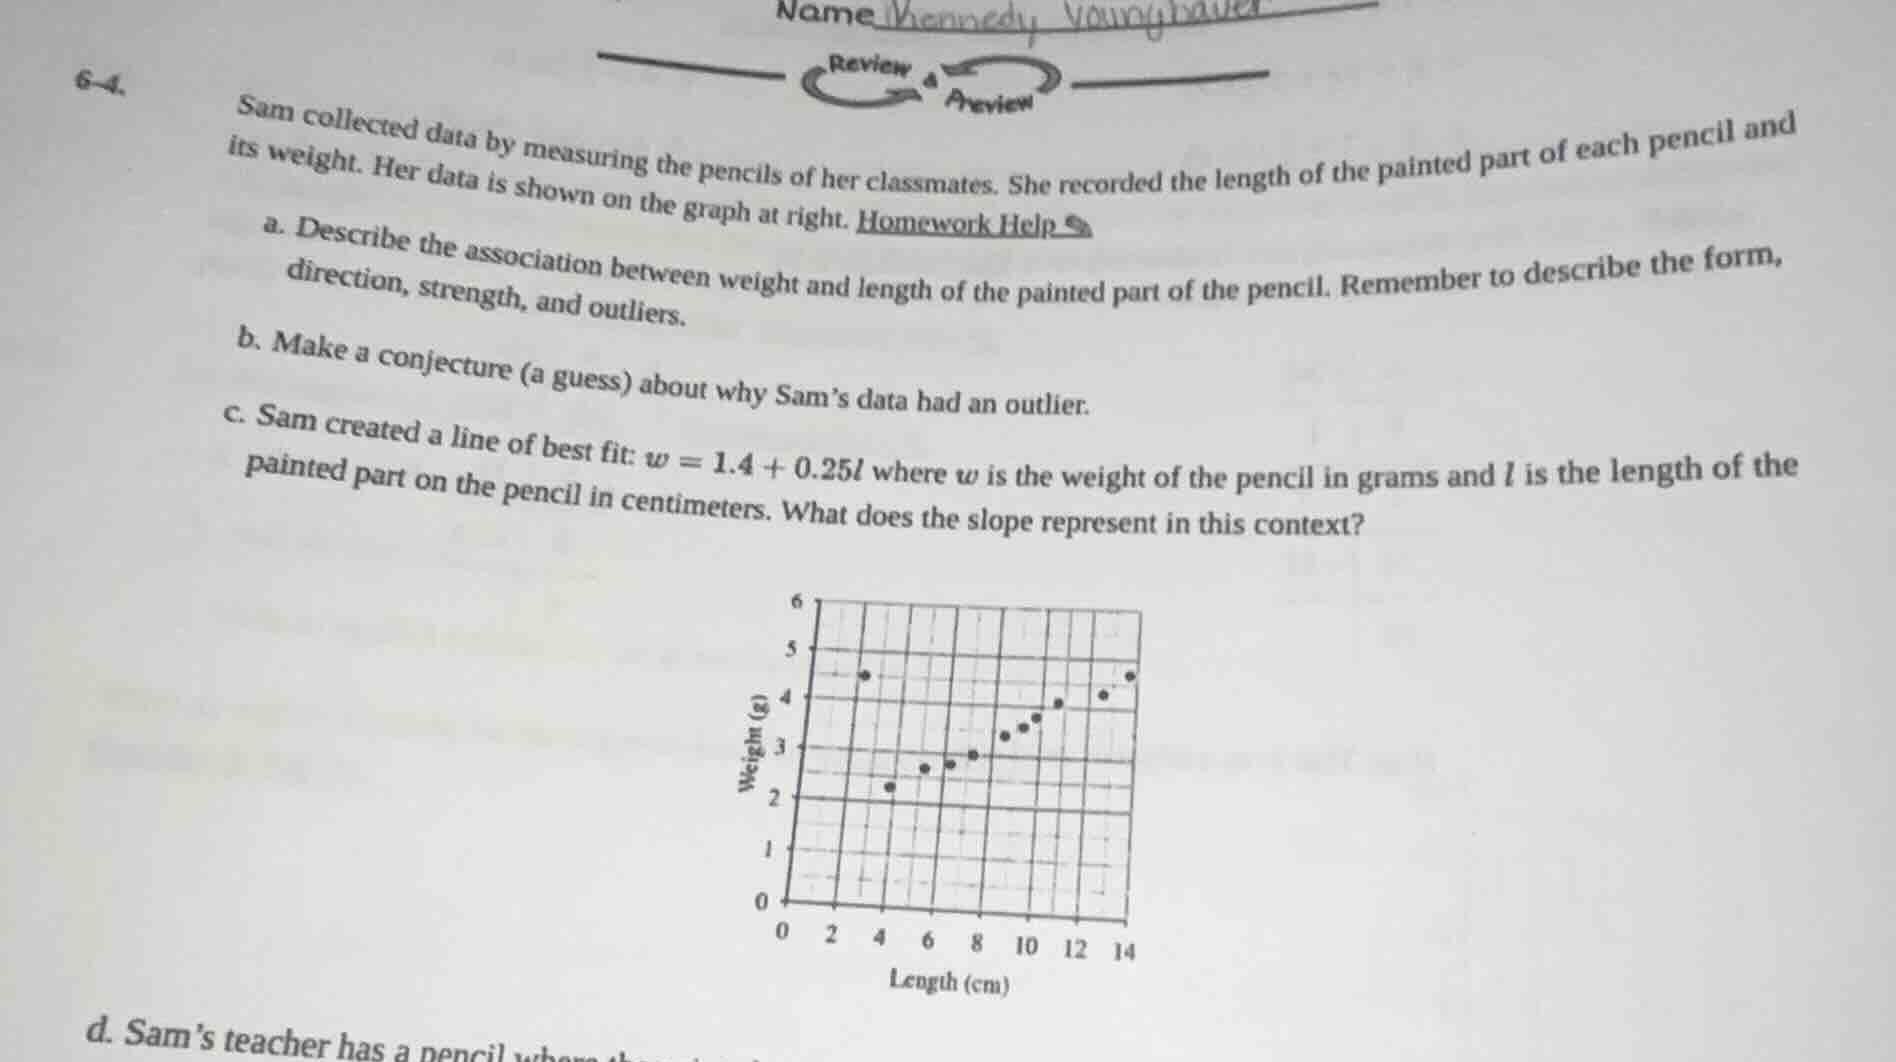
sam collected data by measuring the pencils of her classmates. she recorded the length of the painted part of each pencil and its weight. her data is shown on the graph at right. homework help
a. describe the association between weight and length of the painted part of the pencil. remember to describe the form, direction, strength, and outliers.
b. make a conjecture (a guess) about why sam’s data had an outlier.
c. sam created a line of best fit: $w = 1.4 + 0.25l$ where $w$ is the weight of the pencil in grams and $l$ is the length of the painted part on the pencil in centimeters. what does the slope represent in this context?
d. sam’s teacher has a pencil where
a. Analyze the scatter plot's form, direction, strength, and outliers: The points follow a straight, upward trend with most clustered closely, and one point lies far from the group.
b. Propose a logical reason for the outlier: The outlier pencil could have extra features (like a metal eraser holder) that add weight unrelated to the painted length.
c. Interpret the slope of the linear model: In a linear equation $w = b + ml$, the slope $m$ is the rate of change of $w$ per unit change in $l$.

Snap & solve any problem in the app
Get step-by-step solutions on Sovi AI
Photo-based solutions with guided steps
Explore more problems and detailed explanations
a. The association is linear, positive, strong, with one outlier (a pencil with a short painted length but high weight, around $l=3$ cm, $w=4.5$ g).
b. The outlier is likely a pencil with additional weight from non-painted components, such as a metal clip or a thicker, heavier eraser, that is not related to the length of its painted part.
c. The slope of 0.25 represents that for each 1 centimeter increase in the length of the painted part of the pencil, the predicted weight of the pencil increases by 0.25 grams.