QUESTION IMAGE
Question
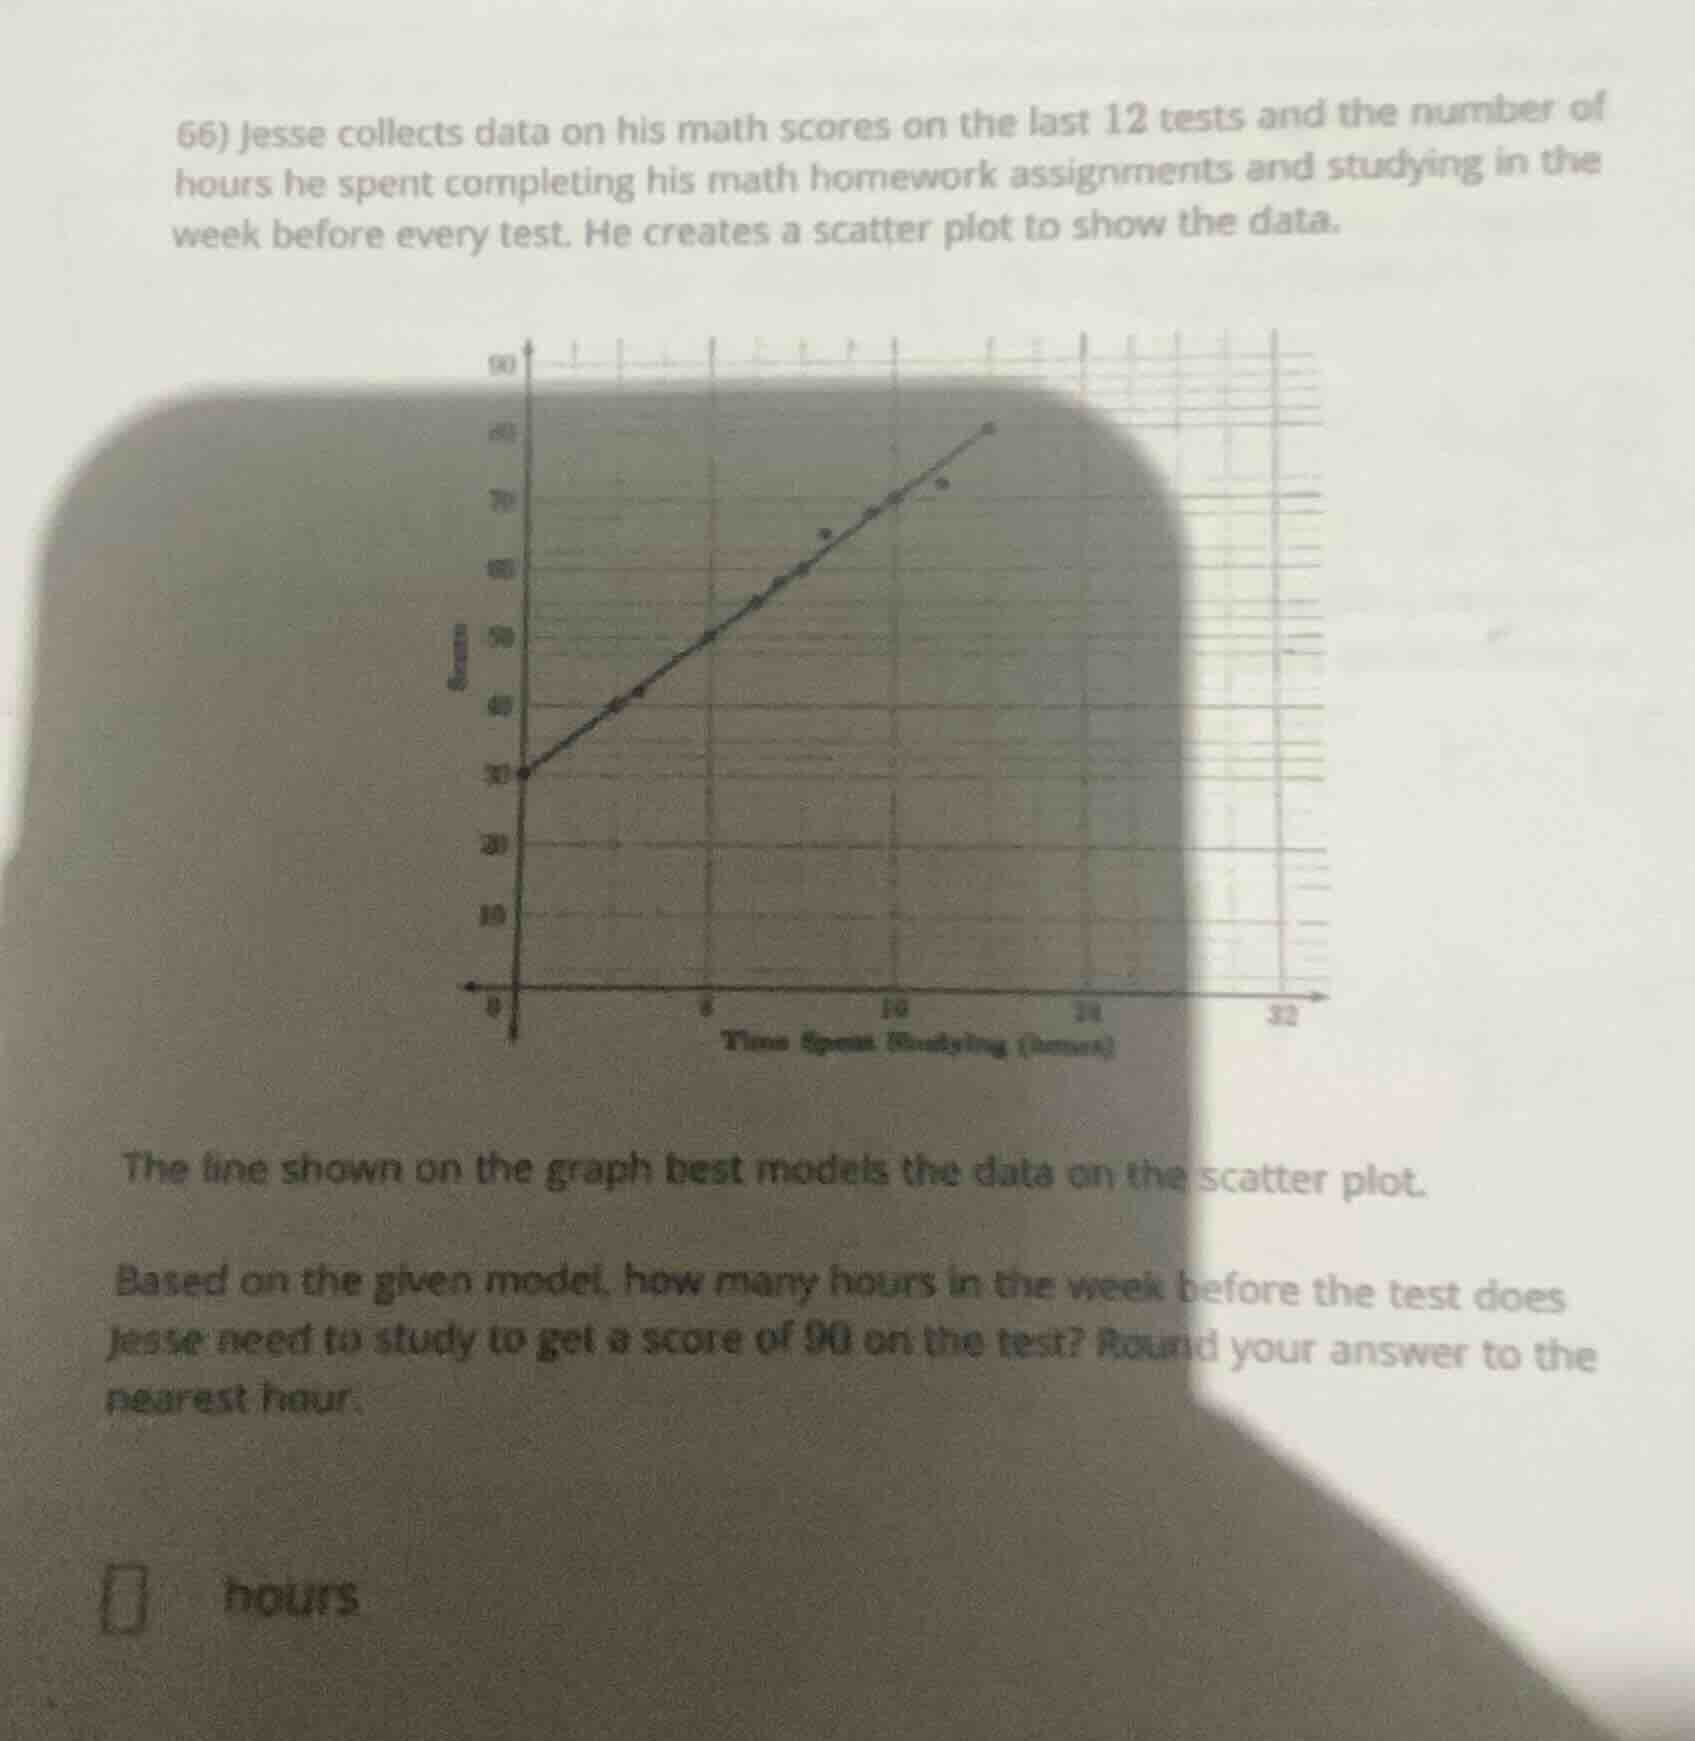
- jesse collects data on his math scores on the last 12 tests and the number of hours he spent completing his math homework assignments and studying in the week before every test. he creates a scatter plot to show the data. the line shown on the graph best models the data on the scatter plot. based on the given model, how many hours in the week before the test does jesse need to study to get a score of 90 on the test? round your answer to the nearest hour. hours
Step1: Find the slope of the line
The line passes through (0, 30) and (10, 70). The slope \( m = \frac{70 - 30}{10 - 0} = \frac{40}{10} = 4 \).
Step2: Write the equation of the line
Using the slope-intercept form \( y = mx + b \), with \( m = 4 \) and \( b = 30 \) (from the y-intercept (0, 30)), the equation is \( y = 4x + 30 \).
Step3: Solve for x when y = 90
Set \( y = 90 \) in the equation: \( 90 = 4x + 30 \). Subtract 30 from both sides: \( 60 = 4x \). Divide both sides by 4: \( x = \frac{60}{4} = 15 \).

Snap & solve any problem in the app
Get step-by-step solutions on Sovi AI
Photo-based solutions with guided steps
Explore more problems and detailed explanations
15