QUESTION IMAGE
Question
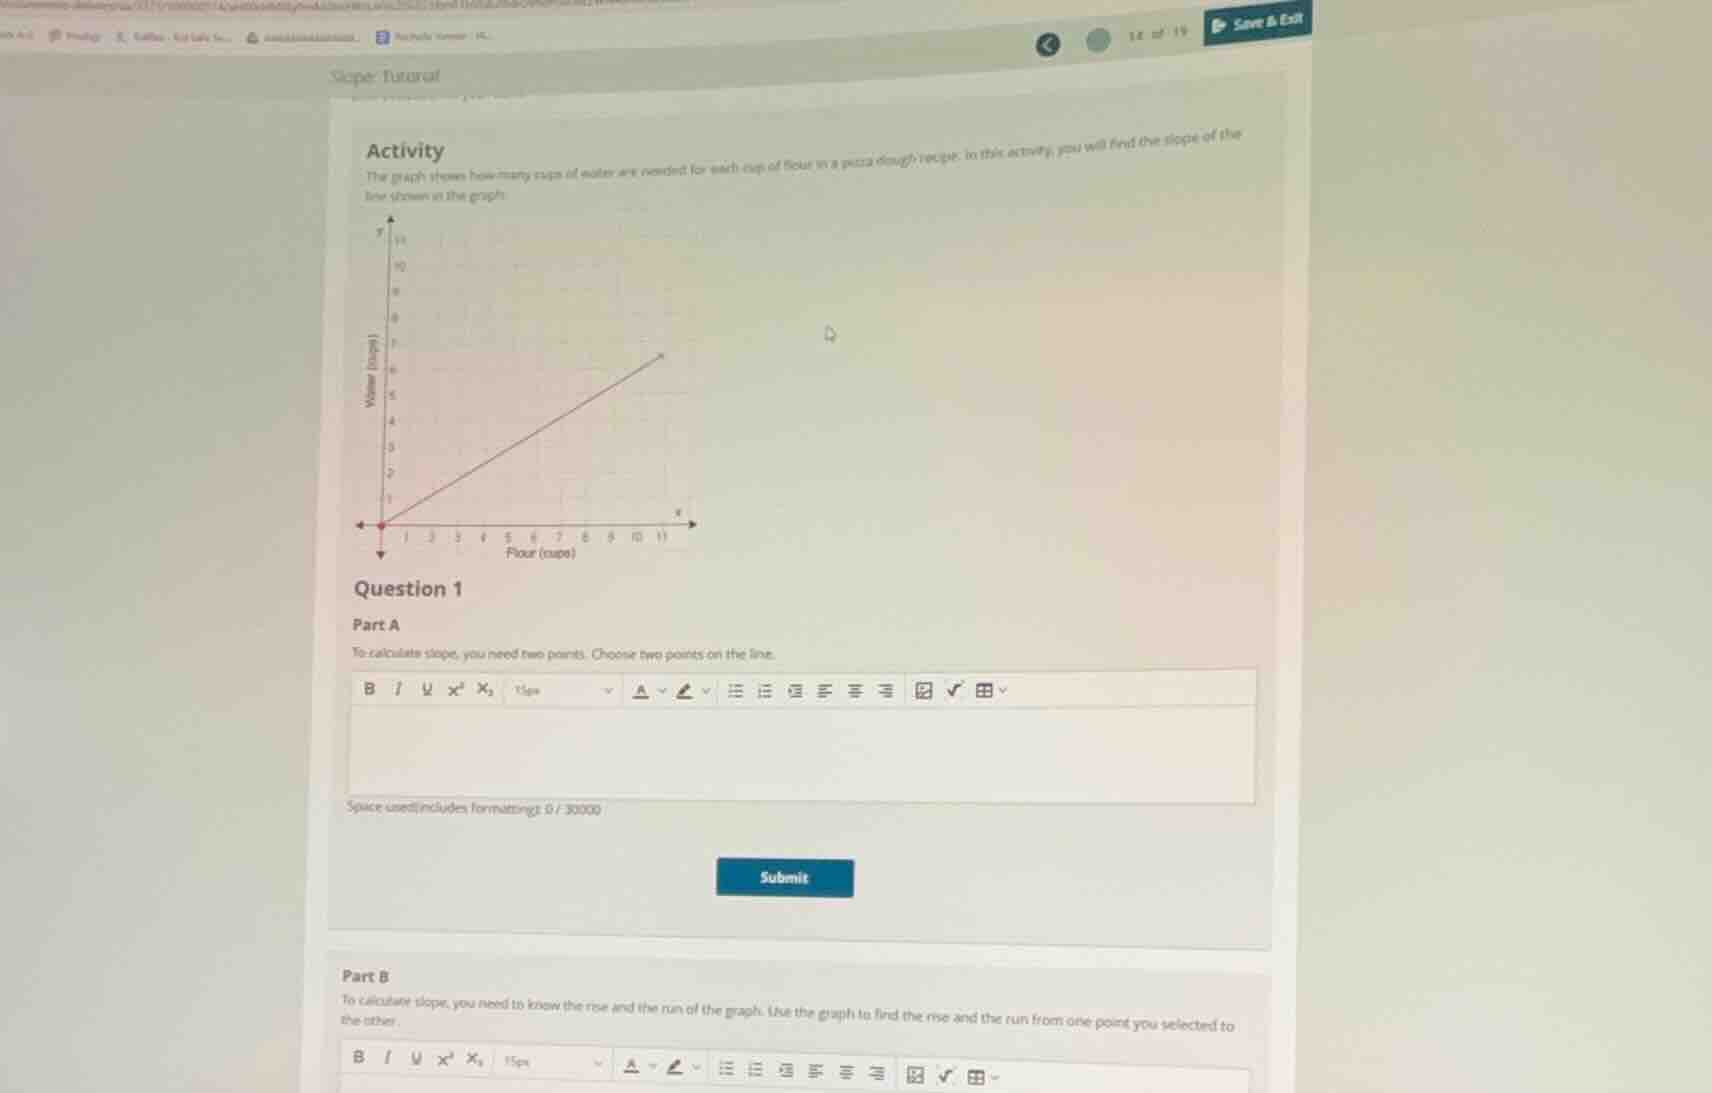
activity
the graph shows how many cups of water are needed for each cup of flour in a pizza dough recipe. in this activity, you will find the slope of the line shown on the graph.
question 1
part a
to calculate slope, you need two points. choose two points on the line.
part b
to calculate slope, you need to know the rise and the run of the graph. use the graph to find the rise and the run from one point you selected to the other.
Part A
Step1: Identify points on the line
The line passes through the origin \((0,0)\) and another point, say \((10, 7)\) (by observing the graph's grid; when \(x = 10\) (flour cups), \(y = 7\) (water cups)). Another simple point is \((0,0)\) and \((10,7)\), or \((0,0)\) and \((5, 3.5)\) (but integer coordinates are easier). Let's pick \((0,0)\) and \((10,7)\).
Step1: Recall rise and run definitions
Rise is the vertical change (\(\Delta y\)), run is the horizontal change (\(\Delta x\)) between two points. Using the points \((0,0)\) and \((10,7)\):
Step2: Calculate rise
Rise \(= y_2 - y_1 = 7 - 0 = 7\)
Step3: Calculate run
Run \(= x_2 - x_1 = 10 - 0 = 10\)

Snap & solve any problem in the app
Get step-by-step solutions on Sovi AI
Photo-based solutions with guided steps
Explore more problems and detailed explanations
\((0, 0)\) and \((10, 7)\) (other valid points like \((0,0)\) and \((5, 3.5)\) or \((2, 1.4)\) can also be used, but \((0,0)\) and \((10,7)\) are clear from the graph's scale).