QUESTION IMAGE
Question
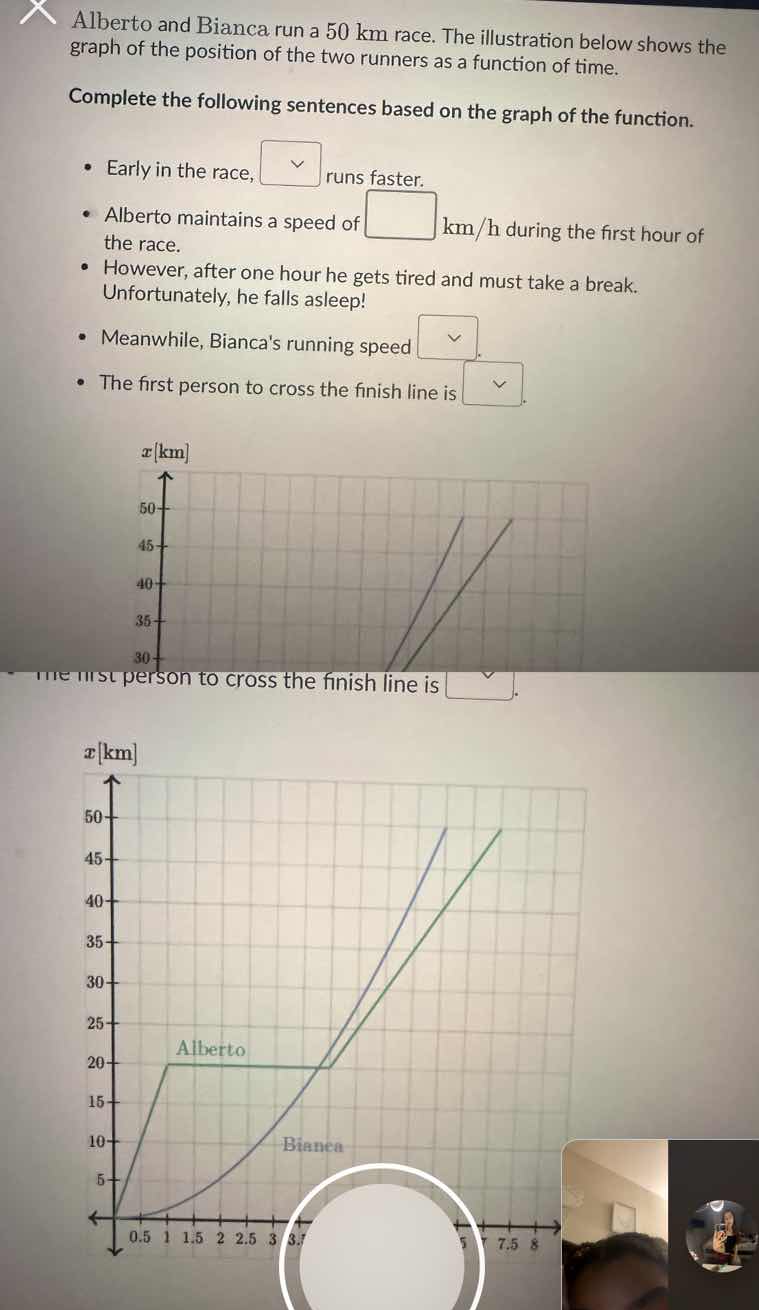
alberto and bianca run a 50 km race. the illustration below shows the graph of the position of the two runners as a function of time. complete the following sentences based on the graph of the function. - early in the race, runs faster. - alberto maintains a speed of km/h during the first hour of the race. - however, after one hour he gets tired and must take a break. unfortunately, he falls asleep! - meanwhile, biancas running speed. - the first person to cross the finish line is. the first person to cross the finish line is.
Step1: Compare early race speeds
Look at the first hour: Alberto reaches 20 km, Bianca reaches <5 km. Alberto's slope is steeper, so he runs faster early.
Step2: Calculate Alberto's 1st hour speed
Speed = $\frac{\text{Distance}}{\text{Time}} = \frac{20\ \text{km}}{1\ \text{h}} = 20\ \text{km/h}$
Step3: Analyze Bianca's speed trend
Bianca's curve gets steeper over time, so her speed increases.
Step4: Identify finish line winner
Alberto stops at 20 km for hours; Bianca reaches 50 km first, then Alberto later.

Snap & solve any problem in the app
Get step-by-step solutions on Sovi AI
Photo-based solutions with guided steps
Explore more problems and detailed explanations
- Early in the race, Alberto runs faster.
- Alberto maintains a speed of $\boldsymbol{20}$ km/h during the first hour of the race.
- Meanwhile, Bianca's running speed increases.
- The first person to cross the finish line is Bianca.