QUESTION IMAGE
Question
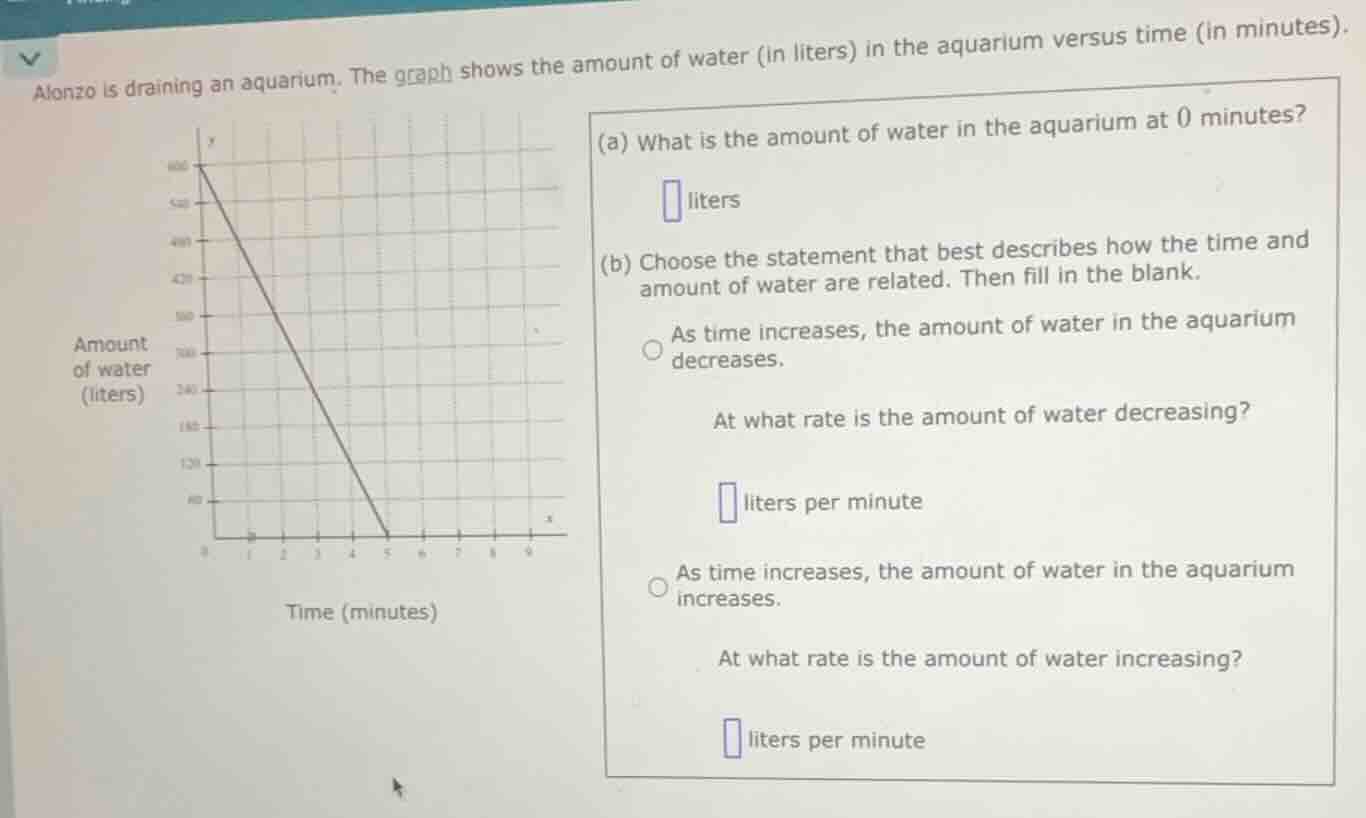
alonzo is draining an aquarium. the graph shows the amount of water (in liters) in the aquarium versus time (in minutes).
(a) what is the amount of water in the aquarium at 0 minutes?
square liters
(b) choose the statement that best describes how the time and amount of water are related. then fill in the blank.
circ as time increases, the amount of water in the aquarium decreases.
at what rate is the amount of water decreasing?
square liters per minute
circ as time increases, the amount of water in the aquarium increases.
at what rate is the amount of water increasing?
square liters per minute
Step1: Find initial water amount
Look at the y-intercept (x=0). The graph starts at (0, 600).
Step2: Identify relationship trend
As time (x) increases, water (y) drops from 600 to 0, so it decreases.
Step3: Calculate decrease rate
Rate = $\frac{\text{Total water lost}}{\text{Total time}} = \frac{600 - 0}{5 - 0} = 120$ liters per minute.

Snap & solve any problem in the app
Get step-by-step solutions on Sovi AI
Photo-based solutions with guided steps
Explore more problems and detailed explanations
(a) 600
(b)
- Correct statement: As time increases, the amount of water in the aquarium decreases.
- Rate: 120