QUESTION IMAGE
Question
analyzing quantities on a graph
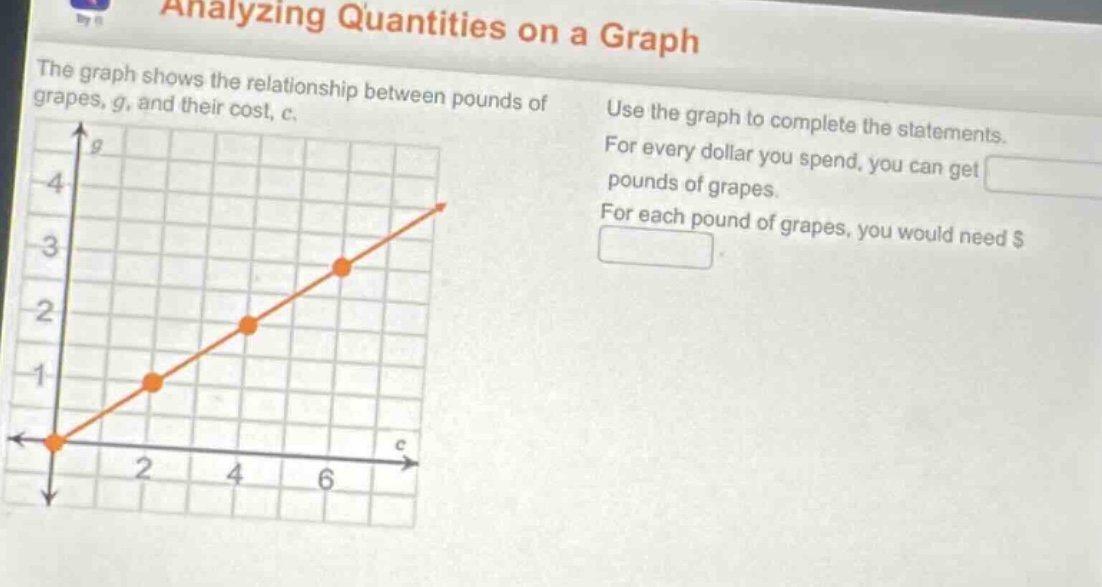
the graph shows the relationship between pounds of grapes, g, and their cost, c.
use the graph to complete the statements.
for every dollar you spend, you can get
pounds of grapes.
for each pound of grapes, you would need $
Step1: Identify graph points
Points: $(c,g)=(2,1), (4,2), (6,3)$
Step2: Find g per dollar
Calculate $\frac{g}{c} = \frac{1}{2}$
Step3: Find cost per pound
Calculate $\frac{c}{g} = \frac{2}{1}=2$

Snap & solve any problem in the app
Get step-by-step solutions on Sovi AI
Photo-based solutions with guided steps
Explore more problems and detailed explanations
For every dollar you spend, you can get $\frac{1}{2}$ pounds of grapes.
For each pound of grapes, you would need $\$$2