QUESTION IMAGE
Question
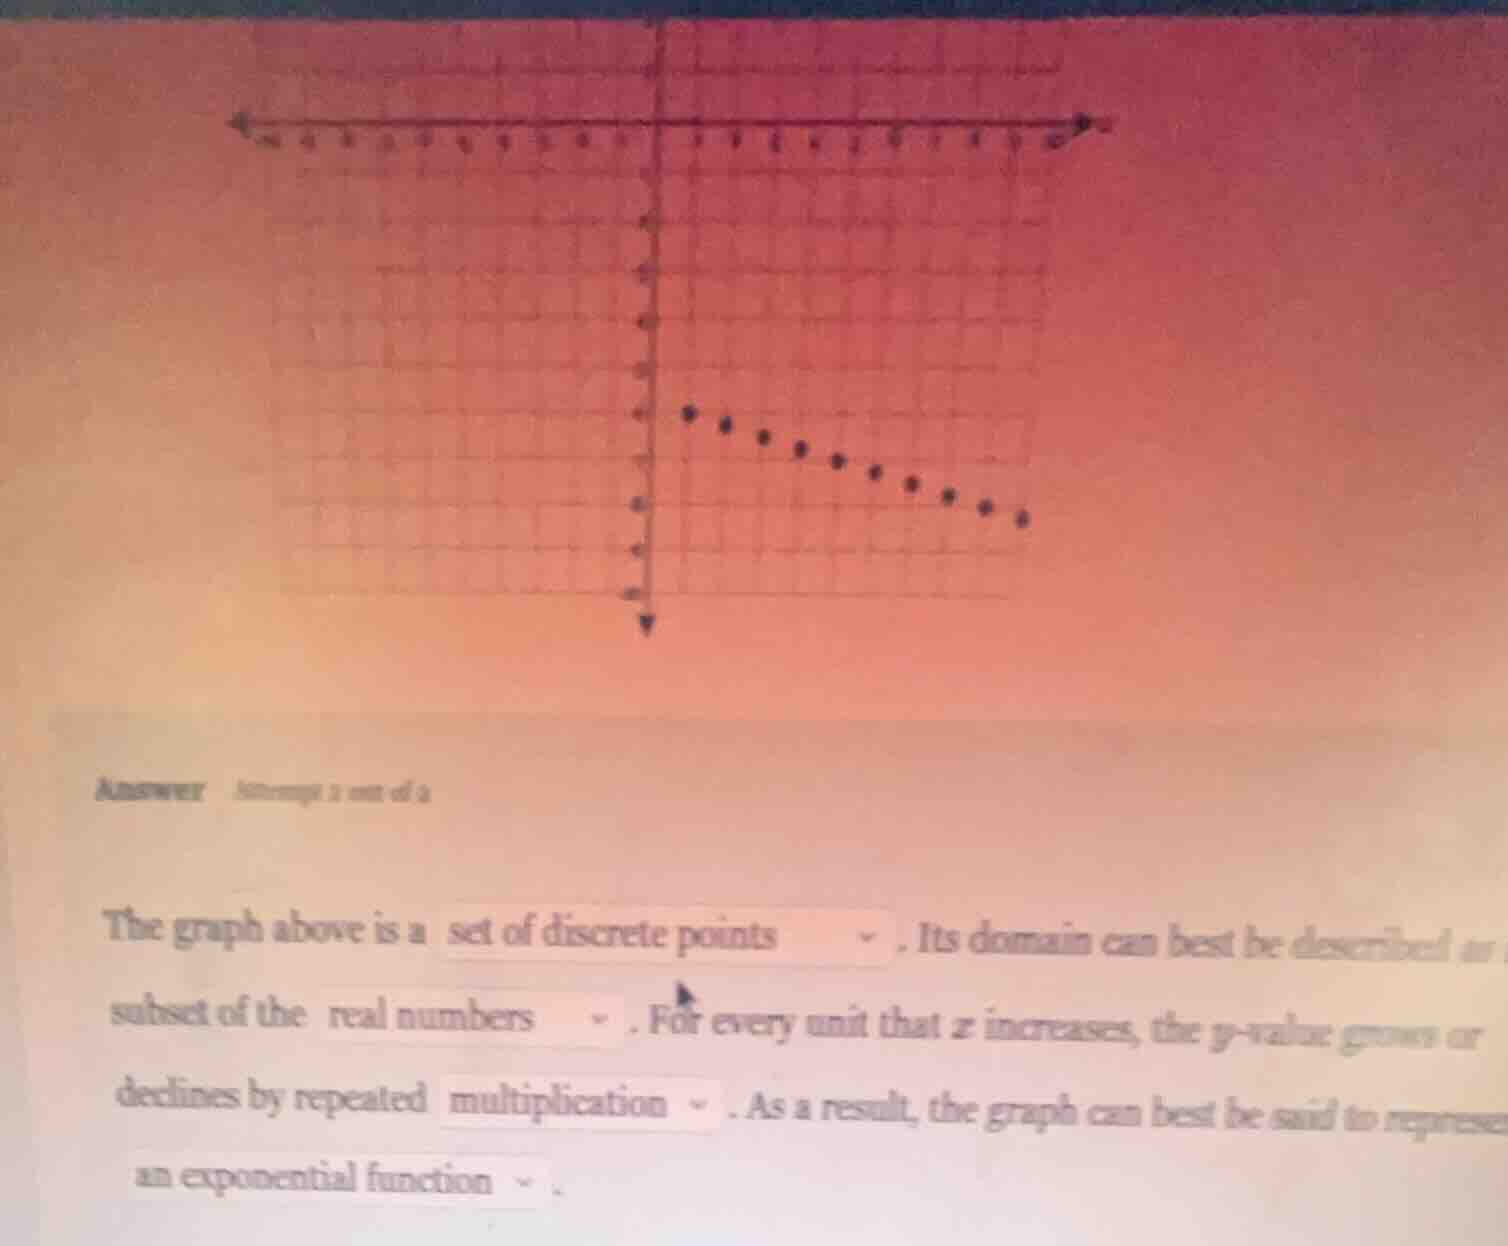
answer attempt 1 out of 2 the graph above is a set of discrete points. its domain can best be described as a subset of the real numbers. for every unit that x increases, the y - value grows or declines by repeated multiplication. as a result, the graph can best be said to represent an exponential function.
To analyze the graph:
Step 1: Identify the graph type
The graph consists of distinct, separate points (not a continuous line or curve), so it is a set of discrete points.
Step 2: Analyze the domain
The \( x \)-values (domain) of discrete points with integer-like spacing (or real - valued spacing for discrete points) are a subset of the real numbers (since each \( x \)-coordinate is a real number, even if the points are discrete).
Step 3: Determine the rate of change
For an exponential function, the \( y \)-value changes by a constant multiplication factor (common ratio) for each unit increase in \( x \). This is distinct from linear functions (which use addition/subtraction). The pattern of repeated multiplication for \( y \)-values as \( x \) increases is a key trait of exponential behavior.
Step 4: Classify the function
Given the discrete points, domain as real numbers (for the \( x \)-values of the points), and \( y \)-values changing by repeated multiplication, the graph represents an exponential function.

Snap & solve any problem in the app
Get step-by-step solutions on Sovi AI
Photo-based solutions with guided steps
Explore more problems and detailed explanations
- Graph type: set of discrete points
- Domain subset: real numbers
- Rate of change: multiplication
- Function type: exponential function