QUESTION IMAGE
Question
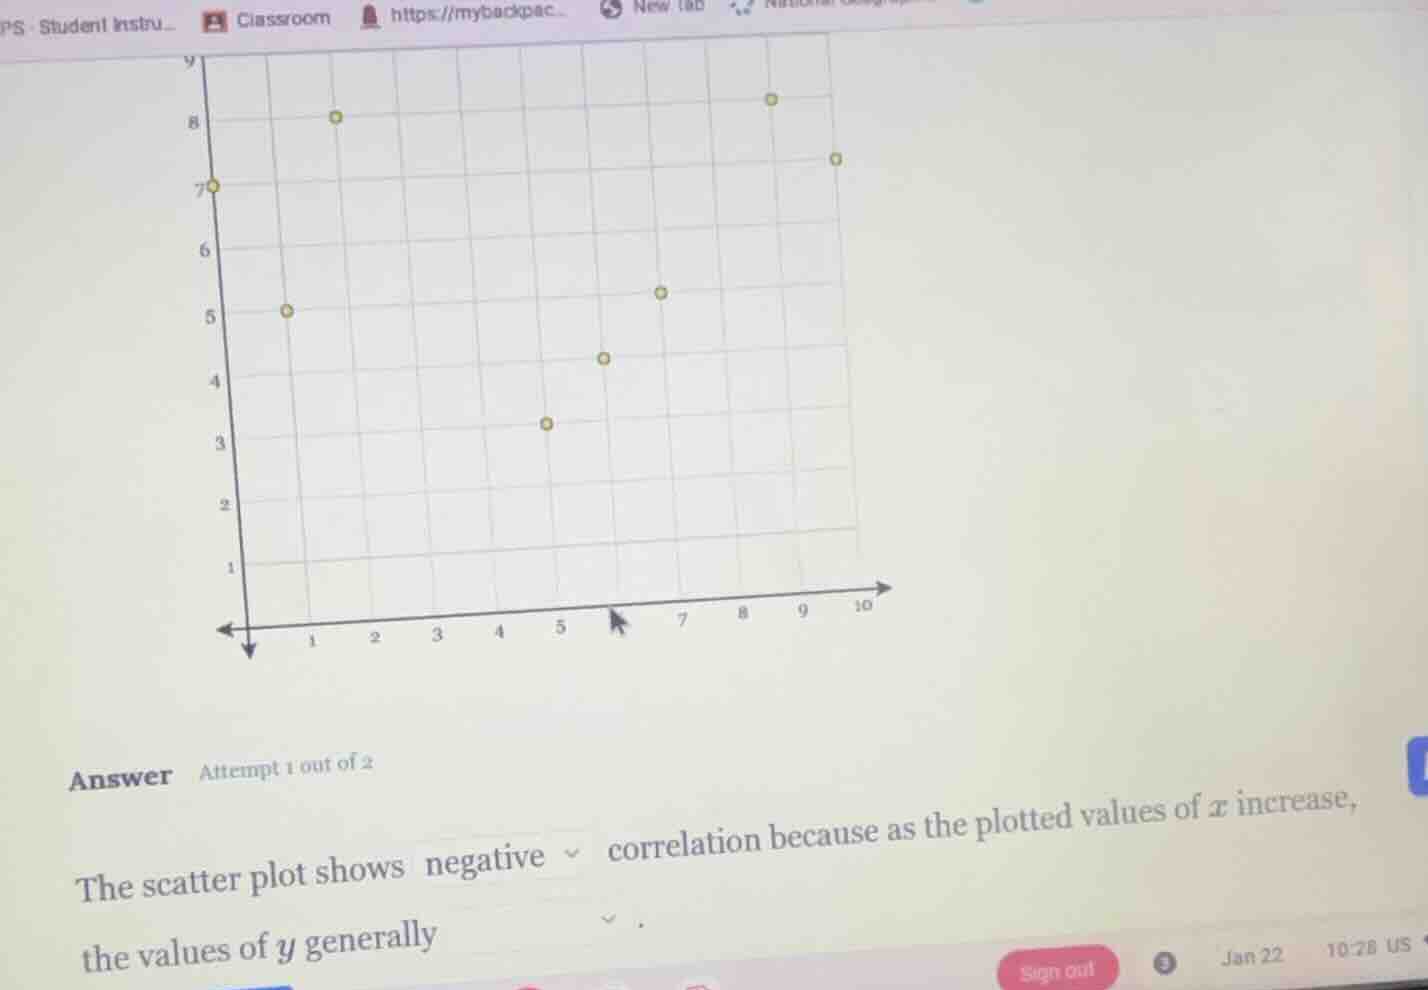
answer attempt 1 out of 2 the scatter plot shows negative correlation because as the plotted values of ( x ) increase, the values of ( y ) generally.
A scatter plot has a positive correlation when as the x-values increase, the y-values also generally increase. Observing the plot: as x goes from 0 to 10, the y-values trend upward (starting at 7, moving to 5, then 8, 3, 4, 5, 8, 7, showing an overall upward pattern rather than downward). So the correlation is positive, with y increasing as x increases.

Snap & solve any problem in the app
Get step-by-step solutions on Sovi AI
Photo-based solutions with guided steps
Explore more problems and detailed explanations
The scatter plot shows positive correlation because as the plotted values of $x$ increase, the values of $y$ generally increase.