QUESTION IMAGE
Question
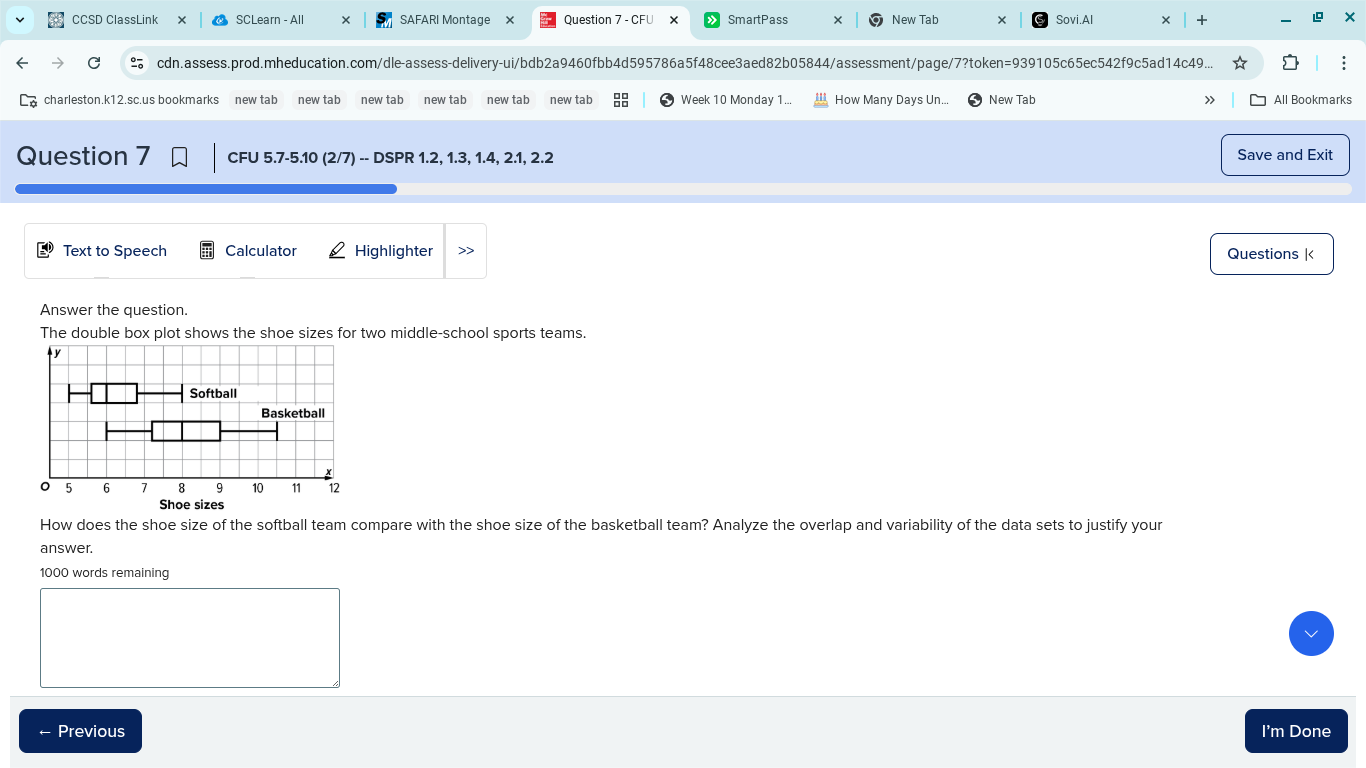
answer the question. the double box plot shows the shoe sizes for two middle - school sports teams. how does the shoe size of the softball team compare with the shoe size of the basketball team? analyze the overlap and variability of the data sets to justify your answer.
To compare the shoe sizes of the two teams, we analyze the box plots:
- Center (Median): The median shoe size for the softball team is lower than that of the basketball team (visually, the middle line of the softball box is left of the basketball box).
- Spread (IQR/Range): The interquartile range (IQR, length of the box) and overall range (distance from minimum to maximum) for softball appear smaller than basketball, meaning basketball shoe sizes have more variability.
- Overlap: There is partial overlap in the middle 50% (IQR) of the data, but the basketball team’s data extends to larger shoe sizes (higher maximum) and has a higher median.
In summary, the softball team has smaller median shoe sizes and less variability, while the basketball team has larger median sizes, greater variability, and extends to bigger shoe sizes. The data sets overlap partially, but basketball’s distribution is shifted toward larger sizes.

Snap & solve any problem in the app
Get step-by-step solutions on Sovi AI
Photo-based solutions with guided steps
Explore more problems and detailed explanations
The softball team has a smaller median shoe size and less variability (smaller IQR/range) compared to the basketball team. The basketball team’s shoe sizes have a higher median, greater spread (more variability), and extend to larger sizes (higher maximum). There is partial overlap in the middle 50% of the data, but basketball’s distribution is shifted toward larger shoe sizes.