QUESTION IMAGE
Question
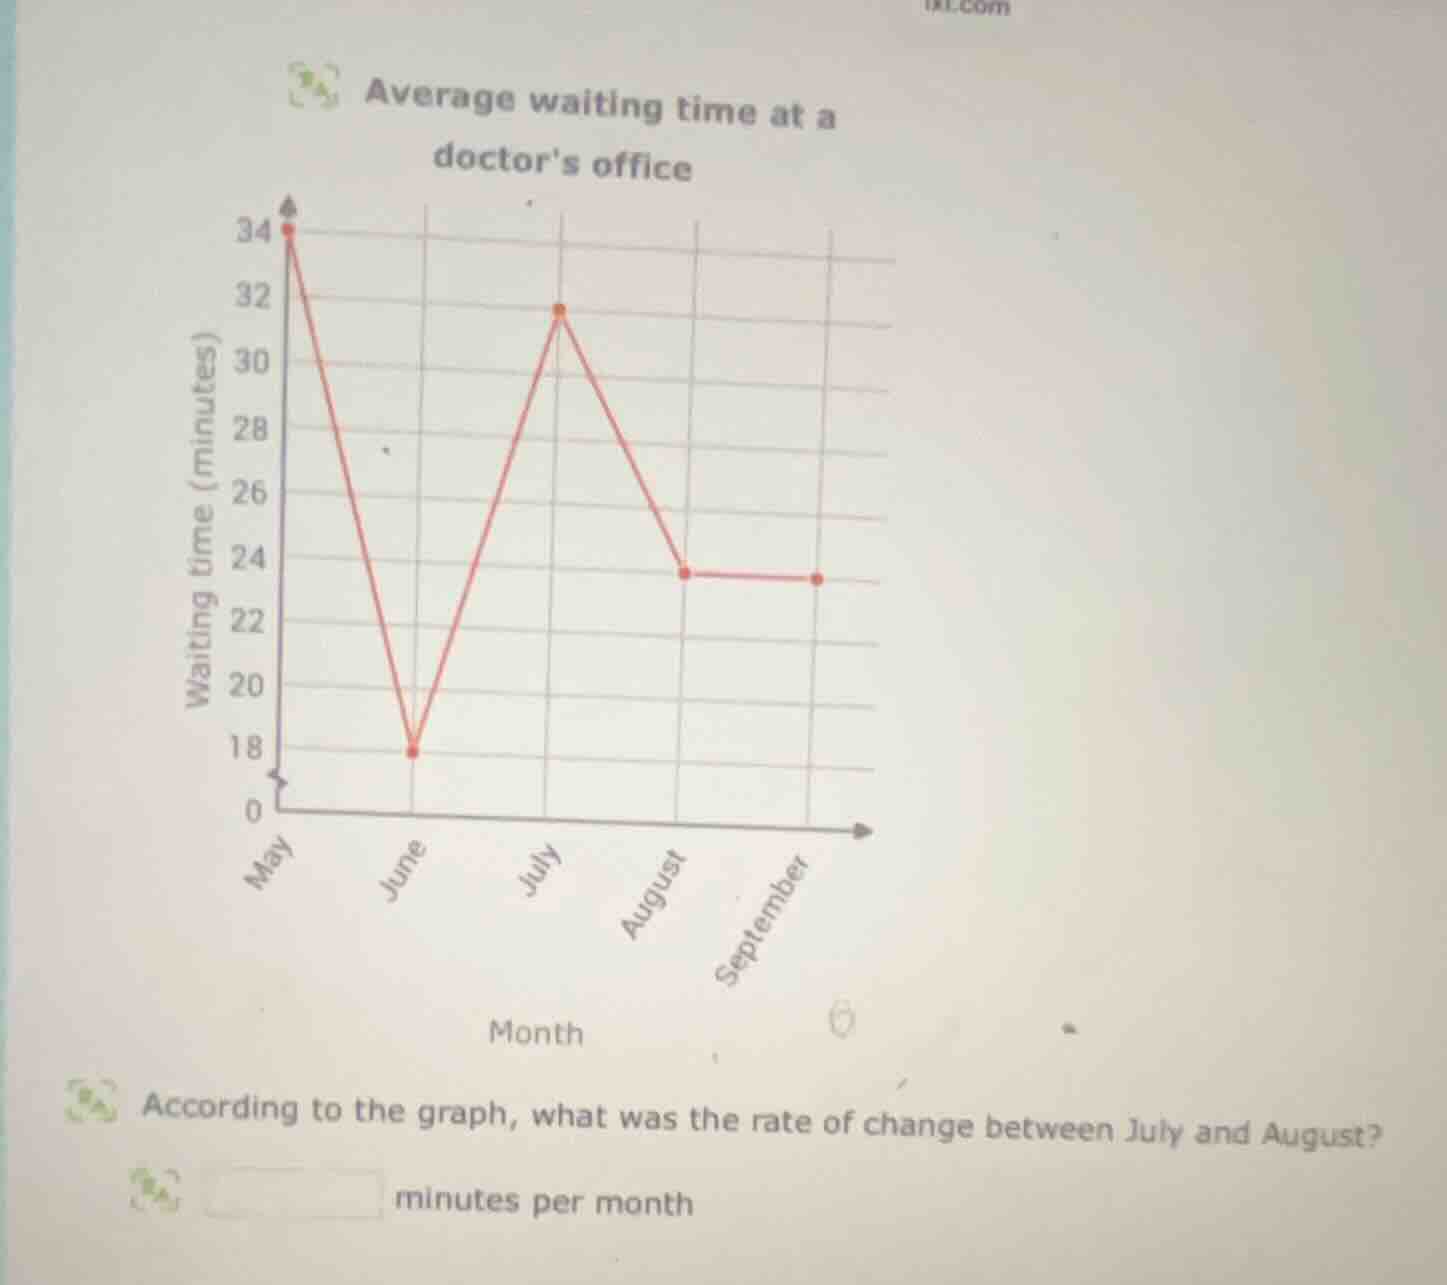
average waiting time at a doctors office
according to the graph, what was the rate of change between july and august?
______ minutes per month
Step1: Identify values from graph
July: 31 minutes, August: 24 minutes
Step2: Calculate rate of change
Rate = $\frac{24 - 31}{1} = -7$

Snap & solve any problem in the app
Get step-by-step solutions on Sovi AI
Photo-based solutions with guided steps
Explore more problems and detailed explanations
-7 minutes per month