QUESTION IMAGE
Question
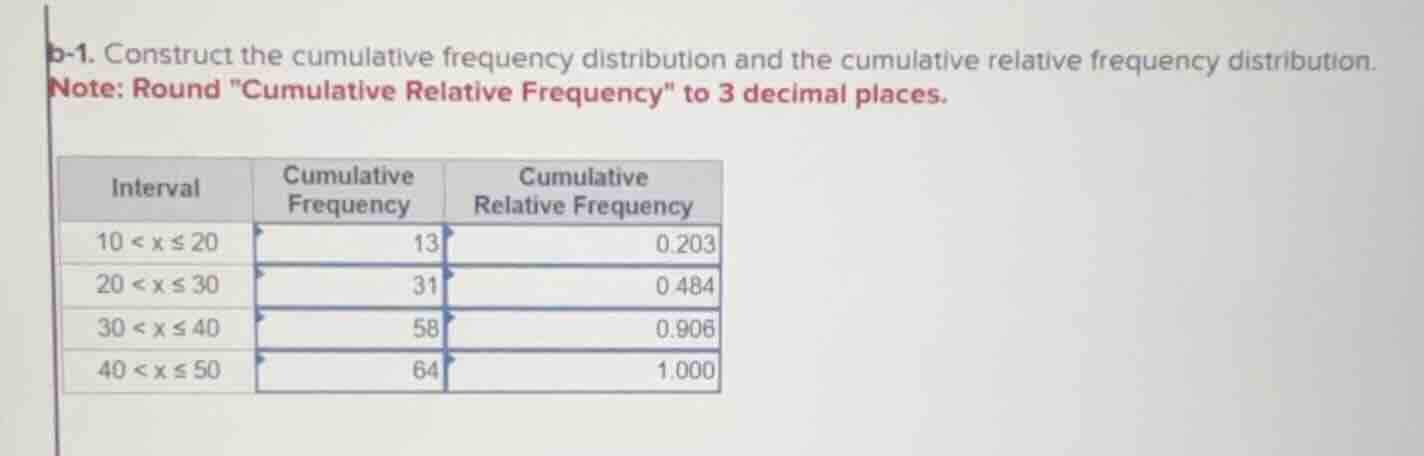
b-1. construct the cumulative frequency distribution and the cumulative relative frequency distribution. note: round \cumulative relative frequency\ to 3 decimal places. interval cumulative frequency cumulative relative frequency 10 < x ≤ 20 13 0.203 20 < x ≤ 30 31 0.484 30 < x ≤ 40 58 0.906 40 < x ≤ 50 64 1.000
To construct the cumulative frequency and cumulative relative frequency distributions, we analyze the given intervals:
Step 1: Understand Cumulative Frequency
Cumulative frequency for an interval is the sum of frequencies of all previous intervals (including the current one). For the first interval \(10 < x \leq 20\), the cumulative frequency is 13 (given). For \(20 < x \leq 30\), it is \(13 + 18 = 31\) (since \(31 - 13 = 18\) is the frequency of this interval). For \(30 < x \leq 40\), it is \(31 + 27 = 58\) ( \(58 - 31 = 27\) ), and for \(40 < x \leq 50\), it is \(58 + 6 = 64\) ( \(64 - 58 = 6\) ).
Step 2: Understand Cumulative Relative Frequency
Cumulative relative frequency is the cumulative frequency divided by the total number of observations (which is 64 here, since the last cumulative frequency is 64).
- For \(10 < x \leq 20\): \(\frac{13}{64} \approx 0.203\) (given, rounded to 3 decimals).
- For \(20 < x \leq 30\): \(\frac{31}{64} \approx 0.484\) (given, rounded to 3 decimals).
- For \(30 < x \leq 40\): \(\frac{58}{64} \approx 0.906\) (given, rounded to 3 decimals).
- For \(40 < x \leq 50\): \(\frac{64}{64} = 1.000\) (given).
The cumulative frequency distribution and cumulative relative frequency distribution are already constructed as shown in the table:
| Interval | Cumulative Frequency | Cumulative Relative Frequency |
|---|---|---|
| \(20 < x \leq 30\) | 31 | 0.484 |
| \(30 < x \leq 40\) | 58 | 0.906 |
| \(40 < x \leq 50\) | 64 | 1.000 |
If the task was to verify or complete this, the table provided is correct. The total number of observations is 64, and the cumulative relative frequency for the last interval is 1.000 (as expected, since it includes all data points).
Final Answer
The cumulative frequency and cumulative relative frequency distributions are as shown in the given table (verified/constructed correctly).

Snap & solve any problem in the app
Get step-by-step solutions on Sovi AI
Photo-based solutions with guided steps
Explore more problems and detailed explanations
To construct the cumulative frequency and cumulative relative frequency distributions, we analyze the given intervals:
Step 1: Understand Cumulative Frequency
Cumulative frequency for an interval is the sum of frequencies of all previous intervals (including the current one). For the first interval \(10 < x \leq 20\), the cumulative frequency is 13 (given). For \(20 < x \leq 30\), it is \(13 + 18 = 31\) (since \(31 - 13 = 18\) is the frequency of this interval). For \(30 < x \leq 40\), it is \(31 + 27 = 58\) ( \(58 - 31 = 27\) ), and for \(40 < x \leq 50\), it is \(58 + 6 = 64\) ( \(64 - 58 = 6\) ).
Step 2: Understand Cumulative Relative Frequency
Cumulative relative frequency is the cumulative frequency divided by the total number of observations (which is 64 here, since the last cumulative frequency is 64).
- For \(10 < x \leq 20\): \(\frac{13}{64} \approx 0.203\) (given, rounded to 3 decimals).
- For \(20 < x \leq 30\): \(\frac{31}{64} \approx 0.484\) (given, rounded to 3 decimals).
- For \(30 < x \leq 40\): \(\frac{58}{64} \approx 0.906\) (given, rounded to 3 decimals).
- For \(40 < x \leq 50\): \(\frac{64}{64} = 1.000\) (given).
The cumulative frequency distribution and cumulative relative frequency distribution are already constructed as shown in the table:
| Interval | Cumulative Frequency | Cumulative Relative Frequency |
|---|---|---|
| \(20 < x \leq 30\) | 31 | 0.484 |
| \(30 < x \leq 40\) | 58 | 0.906 |
| \(40 < x \leq 50\) | 64 | 1.000 |
If the task was to verify or complete this, the table provided is correct. The total number of observations is 64, and the cumulative relative frequency for the last interval is 1.000 (as expected, since it includes all data points).
Final Answer
The cumulative frequency and cumulative relative frequency distributions are as shown in the given table (verified/constructed correctly).