QUESTION IMAGE
Question
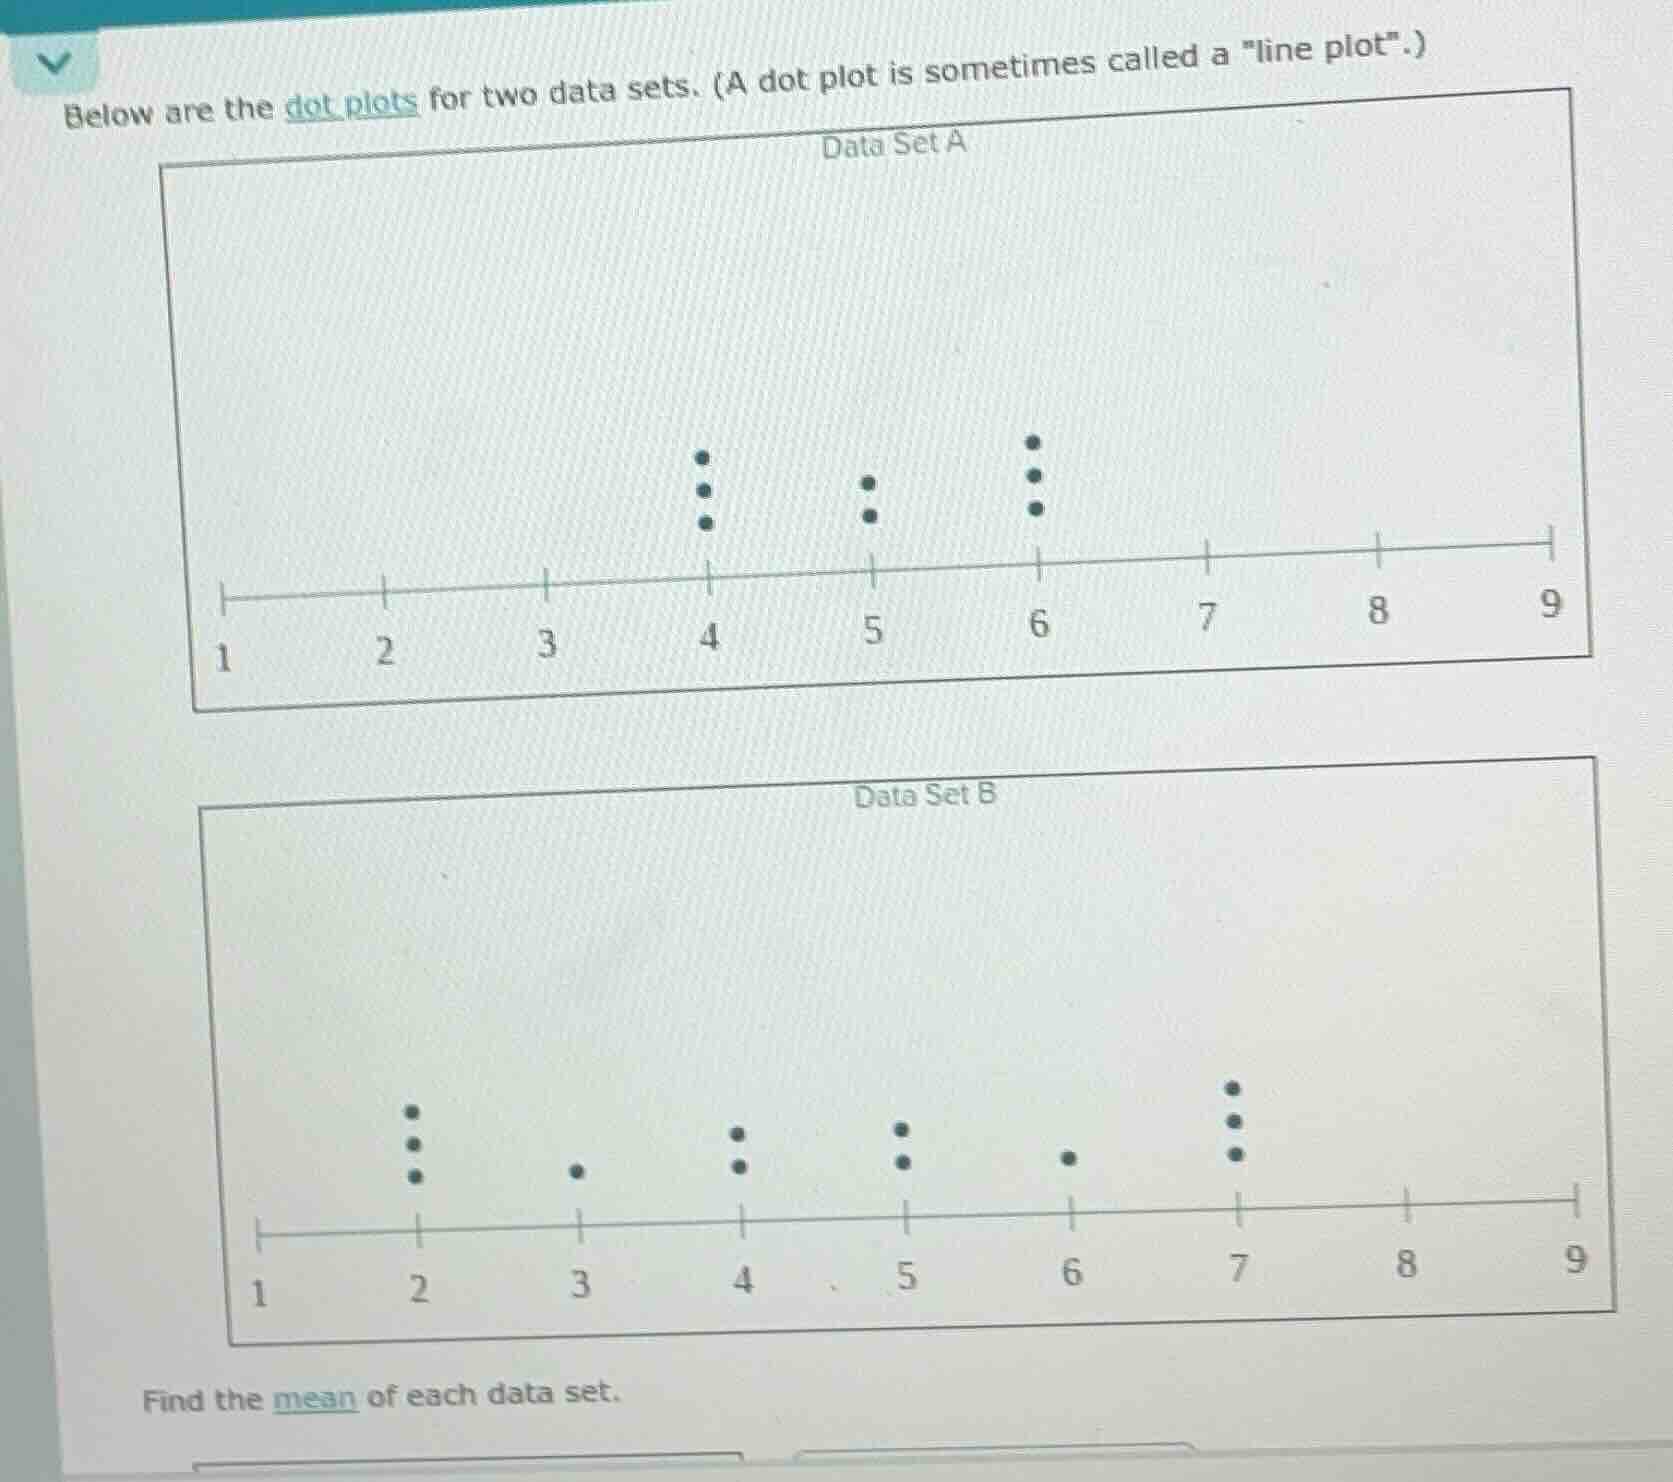
below are the dot plots for two data sets. (a dot plot is sometimes called a \line plot\.)
data set a
dot plot for data set a with number line from 1 to 9, dots: 3 at 4, 2 at 5, 3 at 6
data set b
dot plot for data set b with number line from 1 to 9, dots: 3 at 2, 1 at 3, 2 at 4, 2 at 5, 1 at 6, 3 at 7
find the mean of each data set.
for Data Set A:
Step1: Count data points
At 4: 3 dots, at 5: 2 dots, at 6: 3 dots. Total data points: \(3 + 2 + 3 = 8\).
Step2: Calculate sum
Sum = \((4\times3)+(5\times2)+(6\times3)\) = \(12 + 10 + 18 = 40\).
Step3: Find mean
Mean = \(\frac{40}{8} = 5\).
for Data Set B:
Step1: Count data points
At 2: 3 dots, at 3: 1 dot, at 4: 2 dots, at 5: 2 dots, at 6: 1 dot, at 7: 3 dots. Total data points: \(3 + 1 + 2 + 2 + 1 + 3 = 12\).
Step2: Calculate sum
Sum = \((2\times3)+(3\times1)+(4\times2)+(5\times2)+(6\times1)+(7\times3)\) = \(6 + 3 + 8 + 10 + 6 + 21 = 54\).
Step3: Find mean
Mean = \(\frac{54}{12} = 4.5\).

Snap & solve any problem in the app
Get step-by-step solutions on Sovi AI
Photo-based solutions with guided steps
Explore more problems and detailed explanations
Mean of Data Set A: \(5\)
Mean of Data Set B: \(4.5\)