QUESTION IMAGE
Question
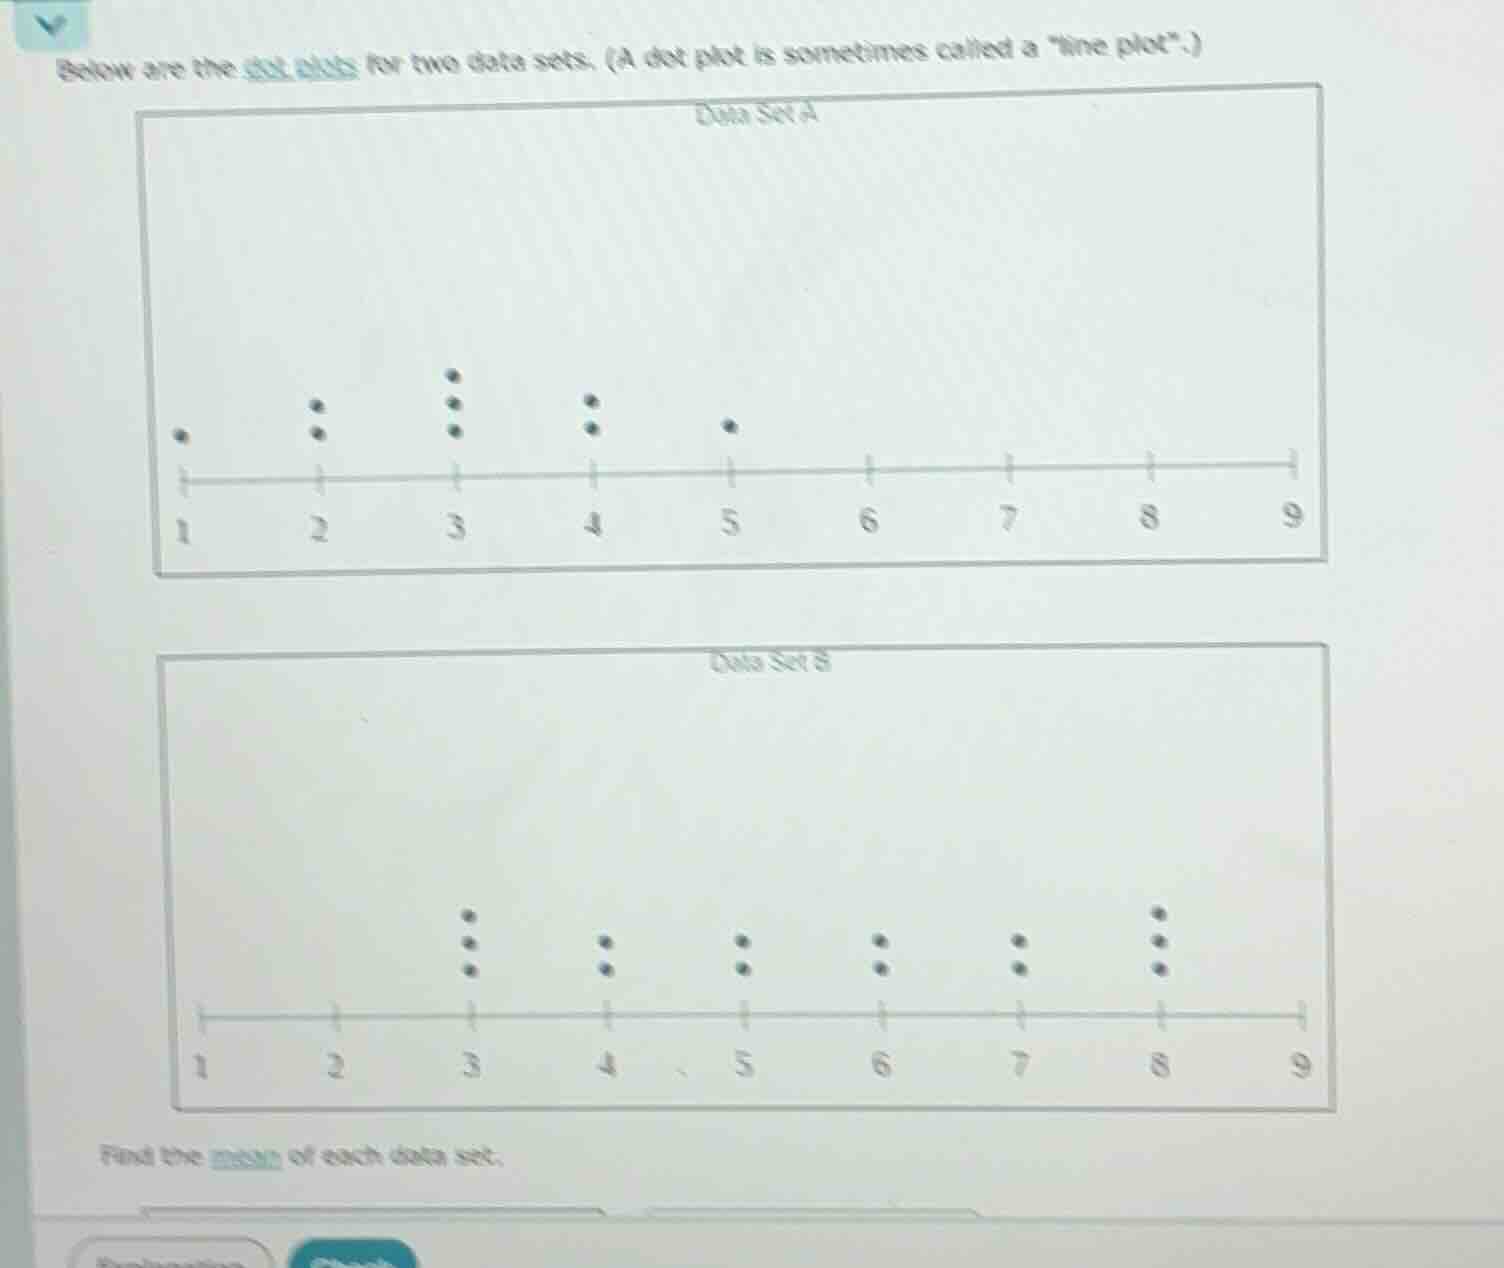
below are the dot plots for two data sets. (a dot plot is sometimes called a \line plot\.)
data set a
dot plot with number line from 1 to 9, dots: 1 at 1, 2 at 2, 3 at 3, 2 at 4, 1 at 5
data set b
dot plot with number line from 1 to 9, dots: 3 at 3, 2 at 4, 2 at 5, 2 at 6, 2 at 7, 3 at 8
find the mean of each data set.
Data Set A
Step1: Count data points
For Data Set A:
- At 1: 1 dot
- At 2: 2 dots
- At 3: 3 dots
- At 4: 2 dots
- At 5: 1 dot
Total data points: \(1 + 2 + 3 + 2 + 1 = 9\)
Step2: Calculate total sum
Sum = \((1\times1)+(2\times2)+(3\times3)+(4\times2)+(5\times1)\)
\(= 1 + 4 + 9 + 8 + 5\)
\(= 27\)
Step3: Find mean
Mean = \(\frac{\text{Sum}}{\text{Number of data points}}=\frac{27}{9} = 3\)
Data Set B
Step1: Count data points
For Data Set B:
- At 3: 3 dots
- At 4: 2 dots
- At 5: 2 dots
- At 6: 2 dots
- At 7: 2 dots
- At 8: 3 dots
Total data points: \(3 + 2 + 2 + 2 + 2 + 3 = 14\)? Wait, no, let's recount. Wait, looking at the dot plot:
Wait, Data Set B:
- 3: 3 dots
- 4: 2 dots
- 5: 2 dots
- 6: 2 dots
- 7: 2 dots
- 8: 3 dots
Wait, no, maybe I miscounted. Wait, the x - axis is 1,2,3,4,5,6,7,8,9. For Data Set B, 1 and 2 have 0 dots. 3: 3 dots, 4: 2, 5: 2, 6: 2, 7: 2, 8: 3. So total data points: \(3 + 2+2 + 2+2 + 3=14\)? Wait, no, let's check again. Wait, 3 has 3, 4 has 2, 5 has 2, 6 has 2, 7 has 2, 8 has 3. So sum of dots: 3 + 2+2 + 2+2 + 3 = 14. Wait, but let's calculate the sum correctly.
Step2: Calculate total sum
Sum = \((3\times3)+(4\times2)+(5\times2)+(6\times2)+(7\times2)+(8\times3)\)
\(= 9+8 + 10+12 + 14+24\)
\(= 9 + 8=17; 17+10 = 27; 27+12 = 39; 39+14 = 53; 53+24 = 77\)? Wait, that can't be. Wait, maybe I made a mistake in counting the dots. Let's look at the dot plot again. For Data Set B:
Looking at the dots:
- 3: three dots (so 3×3)
- 4: two dots (4×2)
- 5: two dots (5×2)
- 6: two dots (6×2)
- 7: two dots (7×2)
- 8: three dots (8×3)
Wait, but maybe the number of dots per value:
Wait, 3: 3, 4: 2, 5: 2, 6: 2, 7: 2, 8: 3. So total number of data points: 3 + 2+2 + 2+2 + 3 = 14. Then sum is \(3\times3 + 4\times2+5\times2 + 6\times2+7\times2+8\times3\)
\(= 9 + 8+10 + 12+14 + 24\)
\(9+8 = 17; 17+10 = 27; 27+12 = 39; 39+14 = 53; 53+24 = 77\). Then mean is \(77\div14 = 5.5\)? Wait, that seems off. Wait, maybe I miscounted the dots. Let's check again. Wait, maybe the dot plot for Data Set B:
Wait, the user's image: Data Set B has dots at 3 (3 dots), 4 (2), 5 (2), 6 (2), 7 (2), 8 (3). Wait, maybe the correct count is:
Wait, 3: 3, 4: 2, 5: 2, 6: 2, 7: 2, 8: 3. So total data points: 3+2+2+2+2+3 = 14. Sum: 3×3 = 9, 4×2 = 8, 5×2 = 10, 6×2 = 12, 7×2 = 14, 8×3 = 24. Sum: 9+8 = 17, 17+10 = 27, 27+12 = 39, 39+14 = 53, 53+24 = 77. Mean: 77/14 = 5.5.
Wait, but maybe I made a mistake. Let's re - examine Data Set A:
Data Set A:
- 1: 1 dot
- 2: 2 dots
- 3: 3 dots
- 4: 2 dots
- 5: 1 dot
Total data points: 1+2+3+2+1 = 9. Sum: 1×1 + 2×2+3×3 + 4×2+5×1 = 1 + 4+9 + 8+5 = 27. Mean: 27/9 = 3. That seems correct.
For Data Set B, let's check the number of dots again. If we look at the x - axis values 3,4,5,6,7,8:
- 3: 3 dots
- 4: 2 dots
- 5: 2 dots
- 6: 2 dots
- 7: 2 dots
- 8: 3 dots
So total dots: 3 + 2+2 + 2+2 + 3 = 14. Sum: (3×3)+(4×2)+(5×2)+(6×2)+(7×2)+(8×3)=9 + 8+10 + 12+14 + 24 = 77. Mean: 77/14 = 5.5.

Snap & solve any problem in the app
Get step-by-step solutions on Sovi AI
Photo-based solutions with guided steps
Explore more problems and detailed explanations
Mean of Data Set A: \(\boldsymbol{3}\)
Mean of Data Set B: \(\boldsymbol{5.5}\)