QUESTION IMAGE
Question
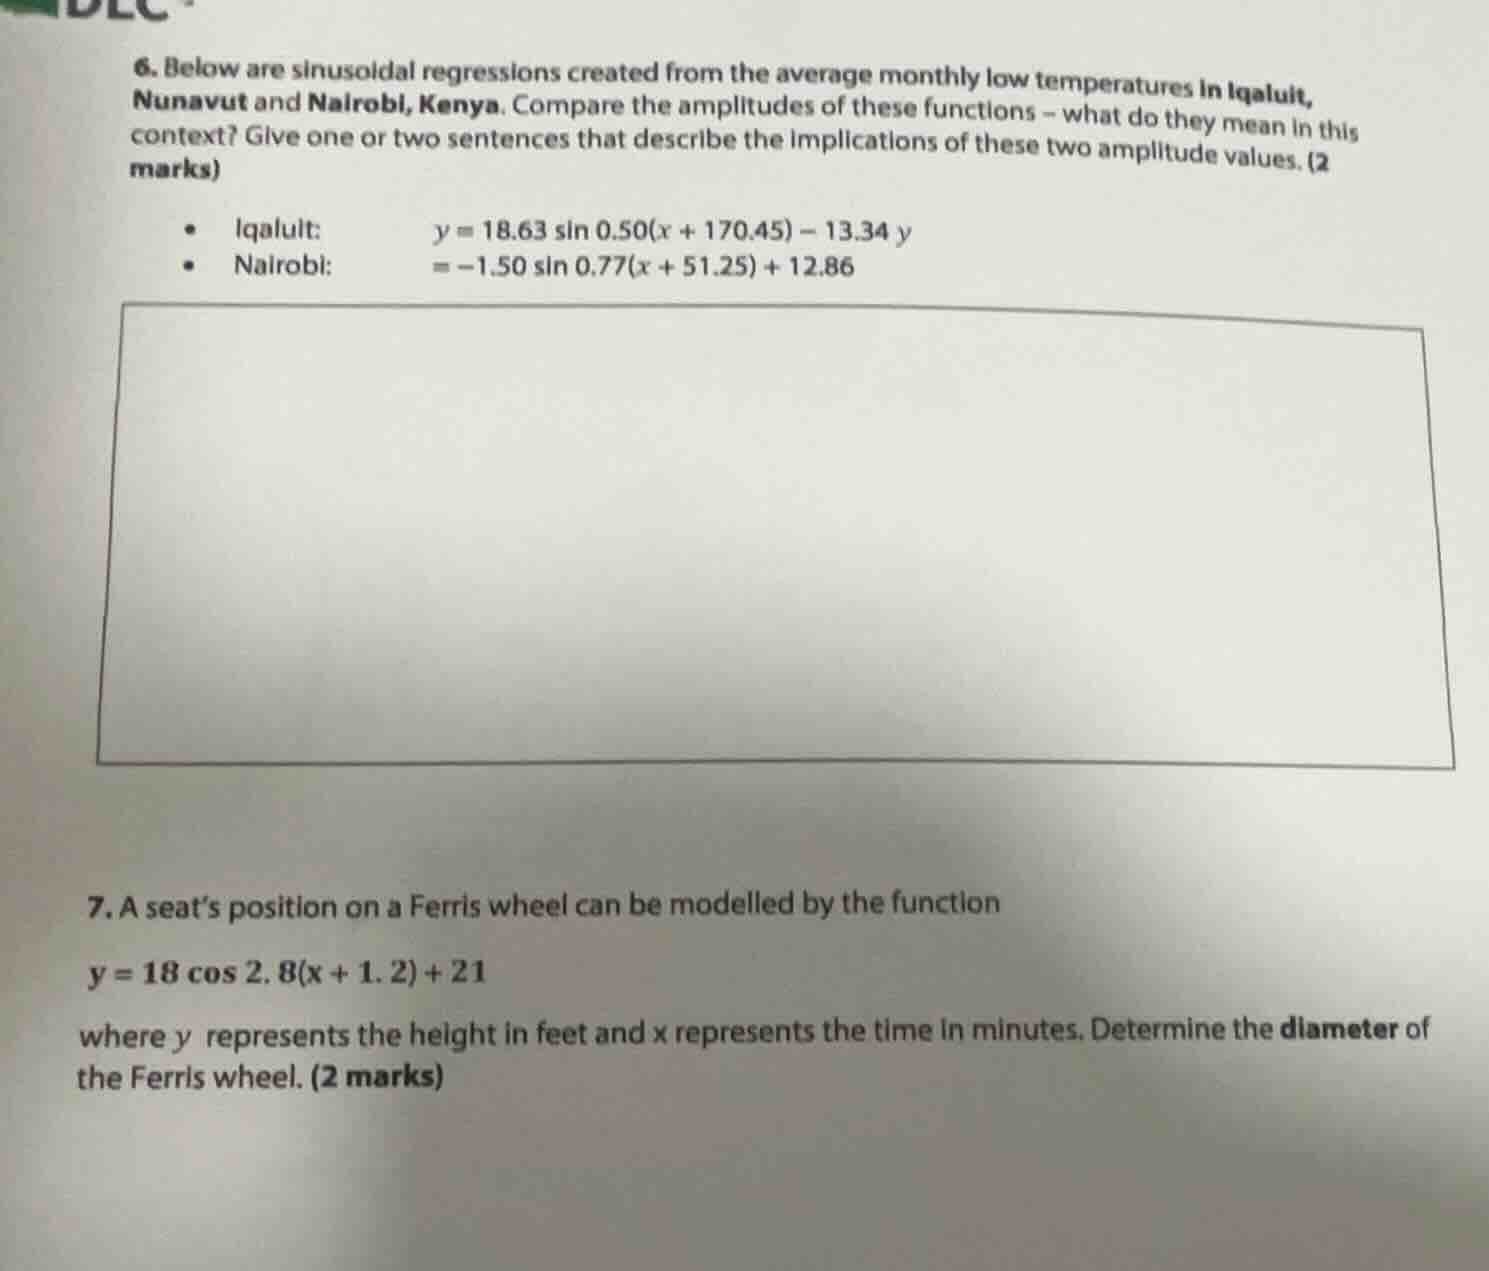
- below are sinusoidal regressions created from the average monthly low temperatures in iqaluit, nunavut and nairobi, kenya. compare the amplitudes of these functions - what do they mean in this context? give one or two sentences that describe the implications of these two amplitude values. (2 marks) - iqaluit: $y = 18.63 \sin 0.50(x + 170.45) - 13.34$ - nairobi: $y = -1.50 \sin 0.77(x + 51.25) + 12.86$ 7. a seat’s position on a ferris wheel can be modelled by the function $y = 18 \cos 2.8(x + 1.2) + 21$ where $y$ represents the height in feet and $x$ represents the time in minutes. determine the diameter of the ferris wheel. (2 marks)
Question 6
The amplitude of a sinusoidal function $y = A\sin(B(x-C))+D$ is $|A|$. For Iqaluit, the amplitude is $|18.63|=18.63$, and for Nairobi, it is $|-1.50|=1.50$. A larger amplitude means a greater range of monthly low temperatures, while a small amplitude means very little variation in monthly low temperatures.
Step1: Identify amplitude
For $y = A\cos(B(x-C))+D$, amplitude $|A|=18$.
Step2: Relate amplitude to diameter
Amplitude equals radius; diameter = $2\times$ radius.
<Expression>
$\text{Diameter} = 2\times18 = 36$
</Expression>

Snap & solve any problem in the app
Get step-by-step solutions on Sovi AI
Photo-based solutions with guided steps
Explore more problems and detailed explanations
Iqaluit has a much larger amplitude (18.63) than Nairobi (1.50), meaning Iqaluit's average monthly low temperatures have a far wider range of variation throughout the year, while Nairobi's monthly low temperatures stay nearly consistent.
---