QUESTION IMAGE
Question
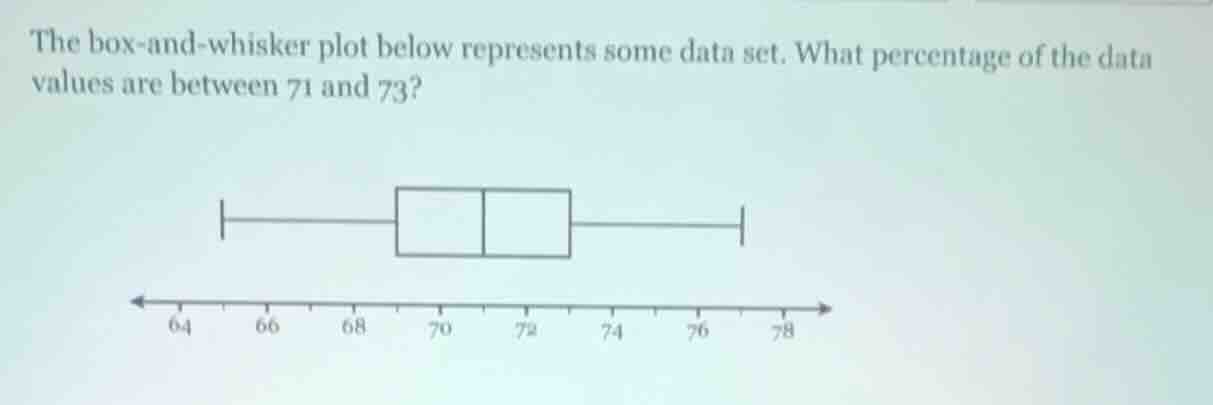
the box-and-whisker plot below represents some data set. what percentage of the data values are between 71 and 73? box-and-whisker plot image with number line from 64 to 78, marked at 64, 66, 68, 70, 72, 74, 76, 78
Step1: Recall box - whisker plot basics
In a box - and - whisker plot, the box is divided into two parts (quartiles), and the entire data set is divided into four equal parts (quartiles), each representing 25% of the data. The median (middle value) divides the data into two halves, and the quartiles (Q1, Q2 = median, Q3) divide each half into two quarters.
Looking at the plot, we assume that the first part of the box (from the left side of the box to the middle of the box) and the second part (from the middle of the box to the right side of the box) each represent a quartile? Wait, no. Wait, the box in a box - and - whisker plot has Q1 (25th percentile), median (50th percentile), and Q3 (75th percentile). The space between Q1 and median is 25% of the data, and between median and Q3 is another 25%? Wait, no. The data from Q1 to Q3 is the inter - quartile range (IQR) and contains 50% of the data. The data below Q1 is 25%, between Q1 and median is 25%, between median and Q3 is 25%, and above Q3 is 25%.
Looking at the number line, 71 is in the first part of the box and 73 is in the second part? Wait, the box is split into two equal - looking parts. So the middle of the box (the line inside the box) is the median. So from the left edge of the box to the median is 25% of the data, and from median to right edge of the box is 25%? Wait, no. Wait, the total data is 100%. The box represents the middle 50% of the data (from Q1 to Q3). If the box is split into two equal - sized rectangles, that means the median is in the middle of the box, so each of the two parts of the box (left of median, right of median) represents 25% of the data (since 50% divided by 2 is 25%).
Looking at the values, 71 is in the left part of the box (between Q1 and median) and 73 is in the right part of the box (between median and Q3)? Wait, the x - axis has marks at 70, 72, etc. Wait, the first part of the box (left rectangle) seems to be from around 70 to 72 (median?), and the second part (right rectangle) from 72 to 74? Wait, no, the numbers on the x - axis: 64, 66, 68, 70, 72, 74, 76, 78. The box starts around 70 (left side of the box) and ends around 74 (right side of the box), and is split into two equal parts (so the split is at 72, the median). So the left part of the box (from 70 to 72) is 25% of the data (between Q1 and median), and the right part (from 72 to 74) is 25% of the data (between median and Q3). But we need the data between 71 and 73. 71 is in the left 25% (Q1 - median) and 73 is in the right 25% (median - Q3). Wait, but maybe the box is divided into two equal regions, each representing 25%? Wait, no, the entire box is 50% (from Q1 to Q3). If the box is split into two equal - width rectangles (visually), then each rectangle is 25% of the total data. So the data between 71 (which is in the first rectangle, Q1 - median) and 73 (which is in the second rectangle, median - Q3) would be 25%? Wait, no. Wait, let's think again.
In a box - and - whisker plot, the four sections (below Q1, Q1 - median, median - Q3, above Q3) each have 25% of the data. The box is from Q1 to Q3 (50% of data). If the box is split into two equal parts (so the median is in the middle of the box), then the data from Q1 to median is 25% and median to Q3 is 25%. Now, looking at the x - axis, 71 is between Q1 (let's say Q1 is around 70) and median (around 72), and 73 is between median (72) and Q3 (around 74). Wait, but the range from 71 to 73: if Q1 is 70, median is 72, Q3 is 74. Then the data from 71 to 72 is part of the Q1 - median (25% of data) and from 72 to 73 is part of the medi…

Snap & solve any problem in the app
Get step-by-step solutions on Sovi AI
Photo-based solutions with guided steps
Explore more problems and detailed explanations
25%