QUESTION IMAGE
Question
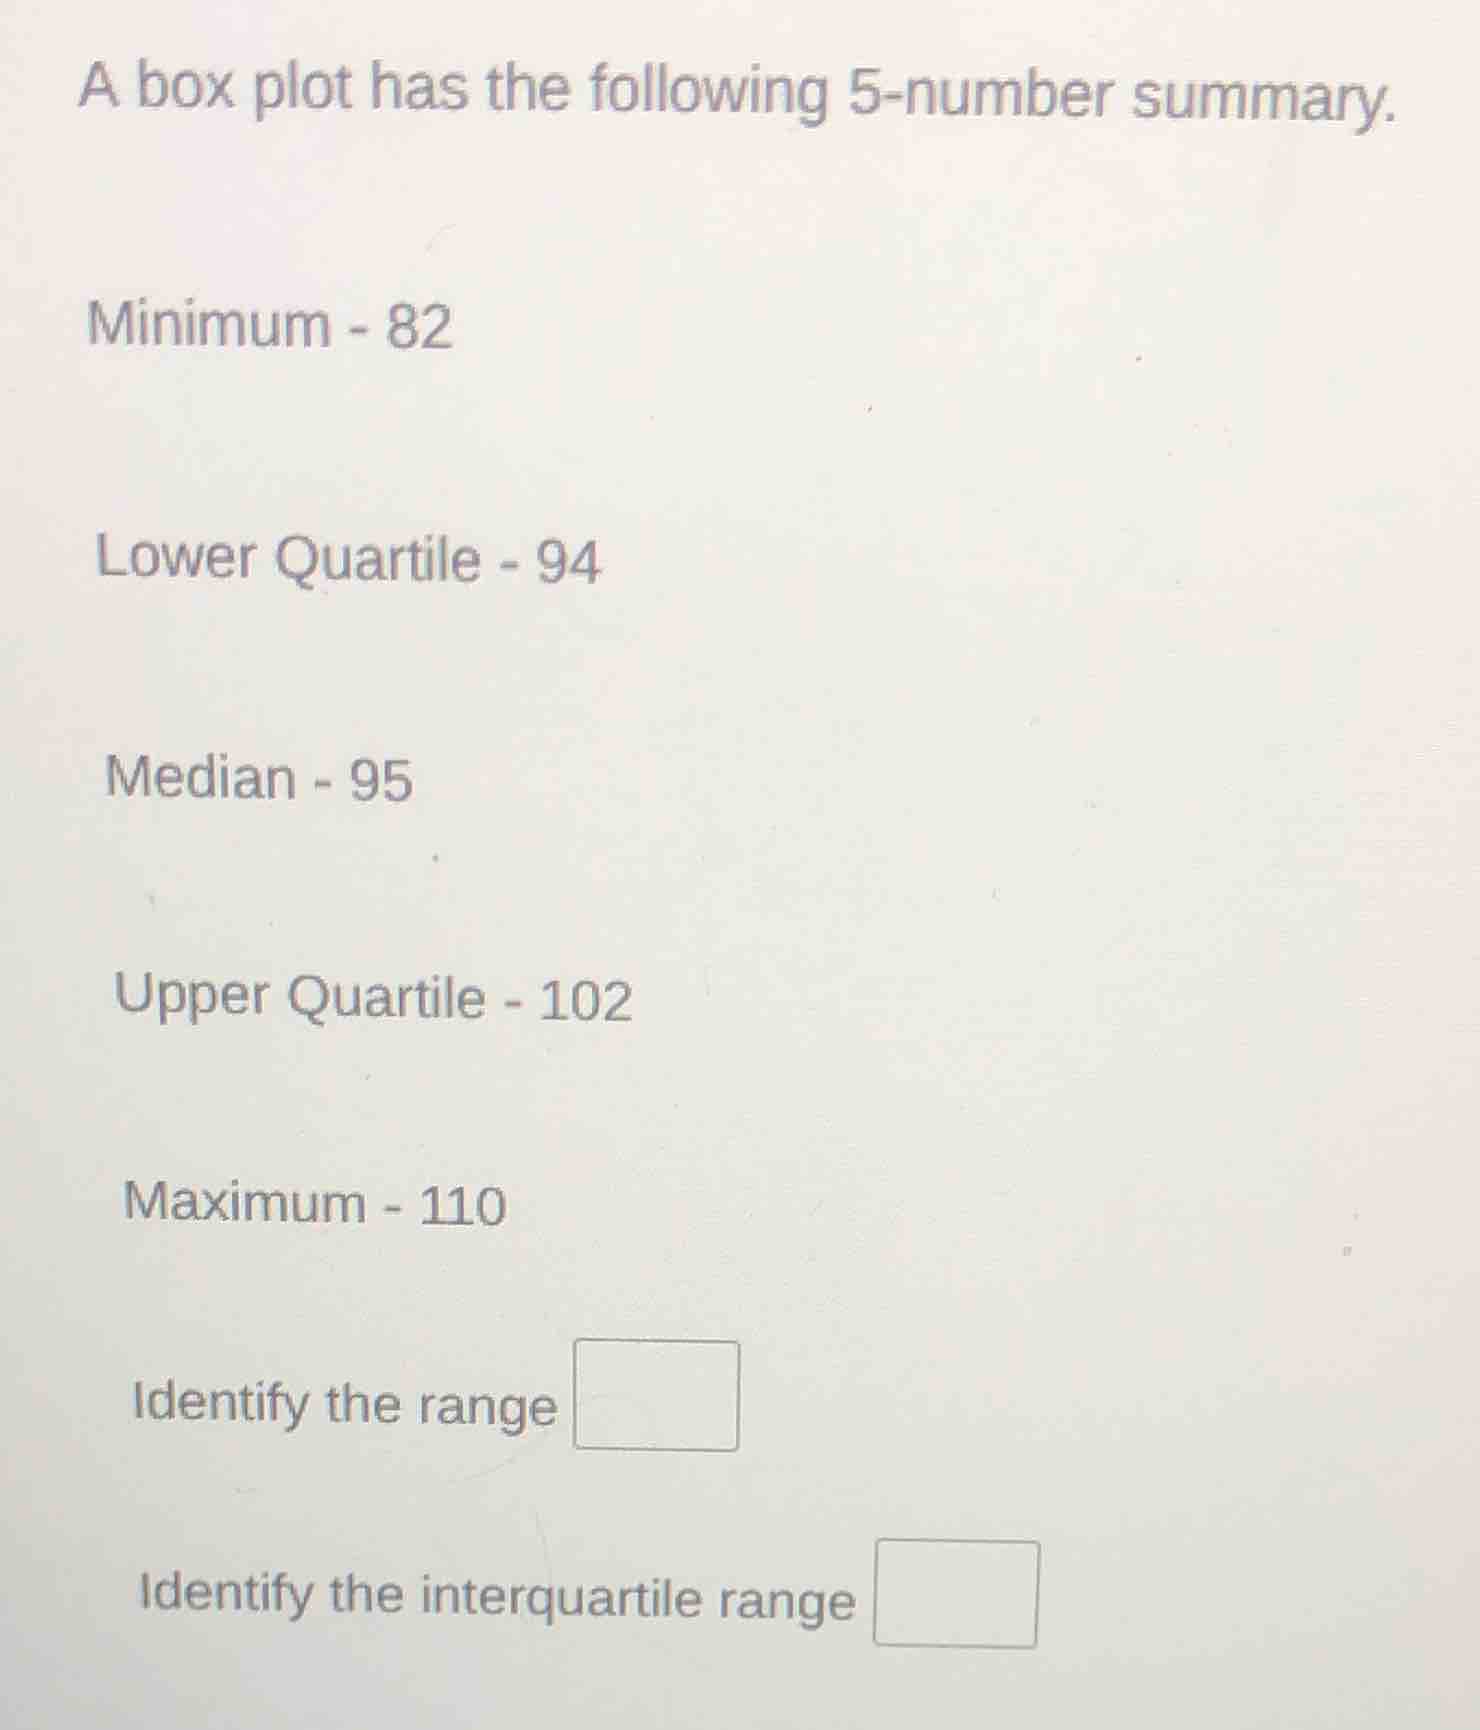
a box plot has the following 5-number summary.
minimum - 82
lower quartile - 94
median - 95
upper quartile - 102
maximum - 110
identify the range
identify the interquartile range
Step1: Calculate the range
The range is calculated as the difference between the maximum and the minimum values. So we use the formula $Range = Maximum - Minimum$.
Given that the maximum value is 110 and the minimum value is 82, we substitute these values into the formula: $Range = 110 - 82$.
Step2: Calculate the interquartile range (IQR)
The interquartile range is calculated as the difference between the upper quartile (Q3) and the lower quartile (Q1). The formula is $IQR = Q3 - Q1$.
Given that the upper quartile (Q3) is 102 and the lower quartile (Q1) is 94, we substitute these values into the formula: $IQR = 102 - 94$.

Snap & solve any problem in the app
Get step-by-step solutions on Sovi AI
Photo-based solutions with guided steps
Explore more problems and detailed explanations
- Range: $110 - 82 = 28$
- Interquartile Range: $102 - 94 = 8$
So the range is 28 and the interquartile range is 8.