QUESTION IMAGE
Question
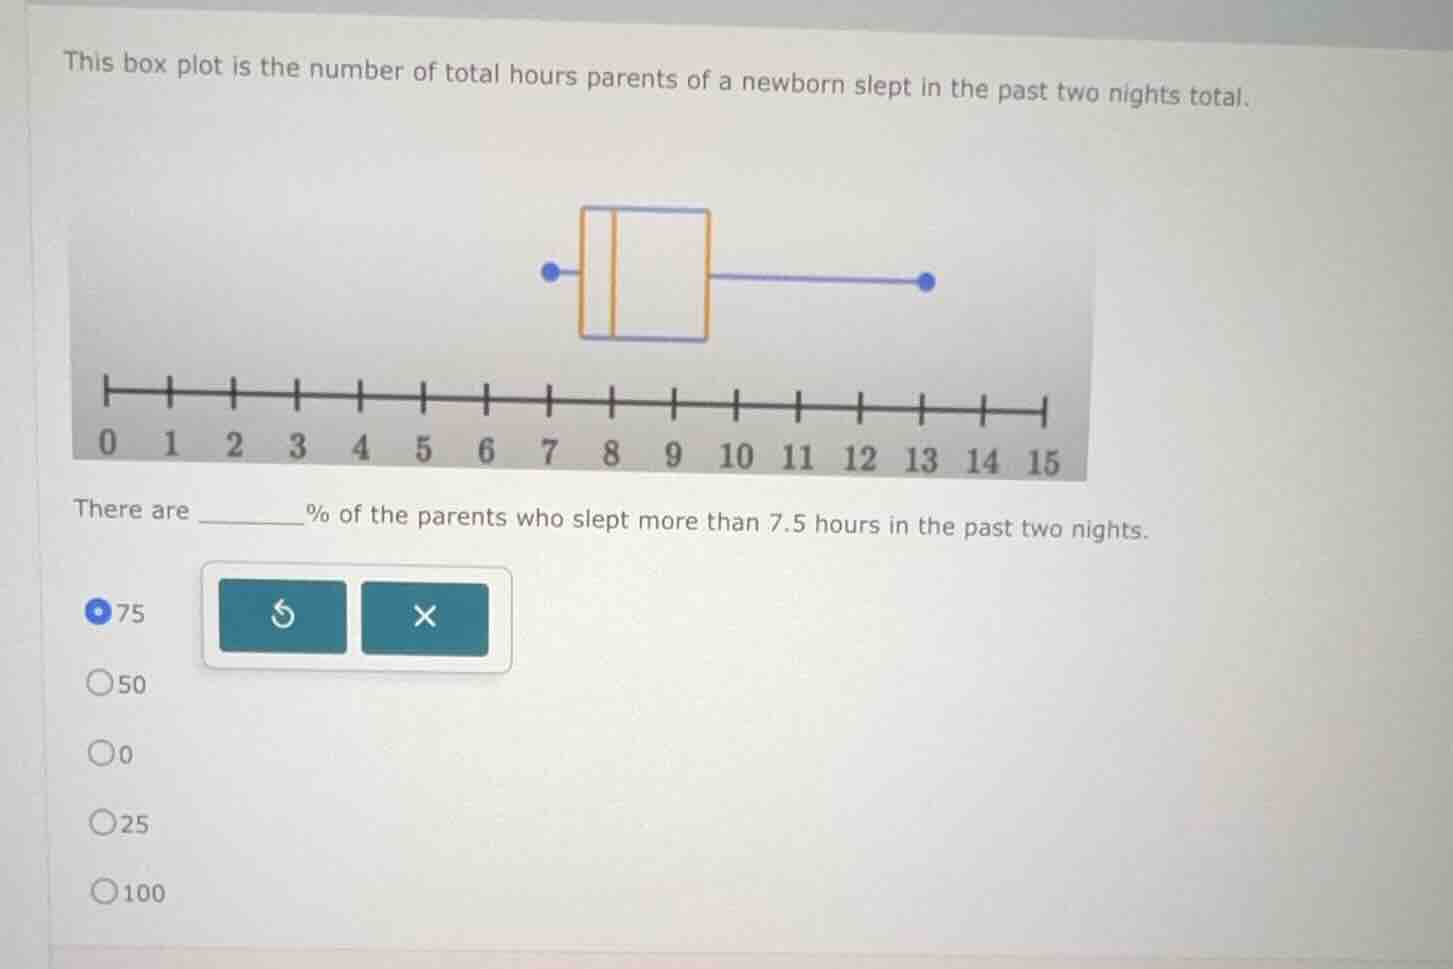
this box plot is the number of total hours parents of a newborn slept in the past two nights total.
there are ______% of the parents who slept more than 7.5 hours in the past two nights.
○75
○50
○0
○25
○100
Step1: Identify median in box plot
The line inside the box of a box plot represents the median (50th percentile), which is marked at 7.5 hours here.
Step2: Interpret percentile meaning
The median divides the data: 50% of data is above the median, 50% is below. So parents who slept more than 7.5 hours make up 50% of the group.

Snap & solve any problem in the app
Get step-by-step solutions on Sovi AI
Photo-based solutions with guided steps
Explore more problems and detailed explanations
B. 50