QUESTION IMAGE
Question
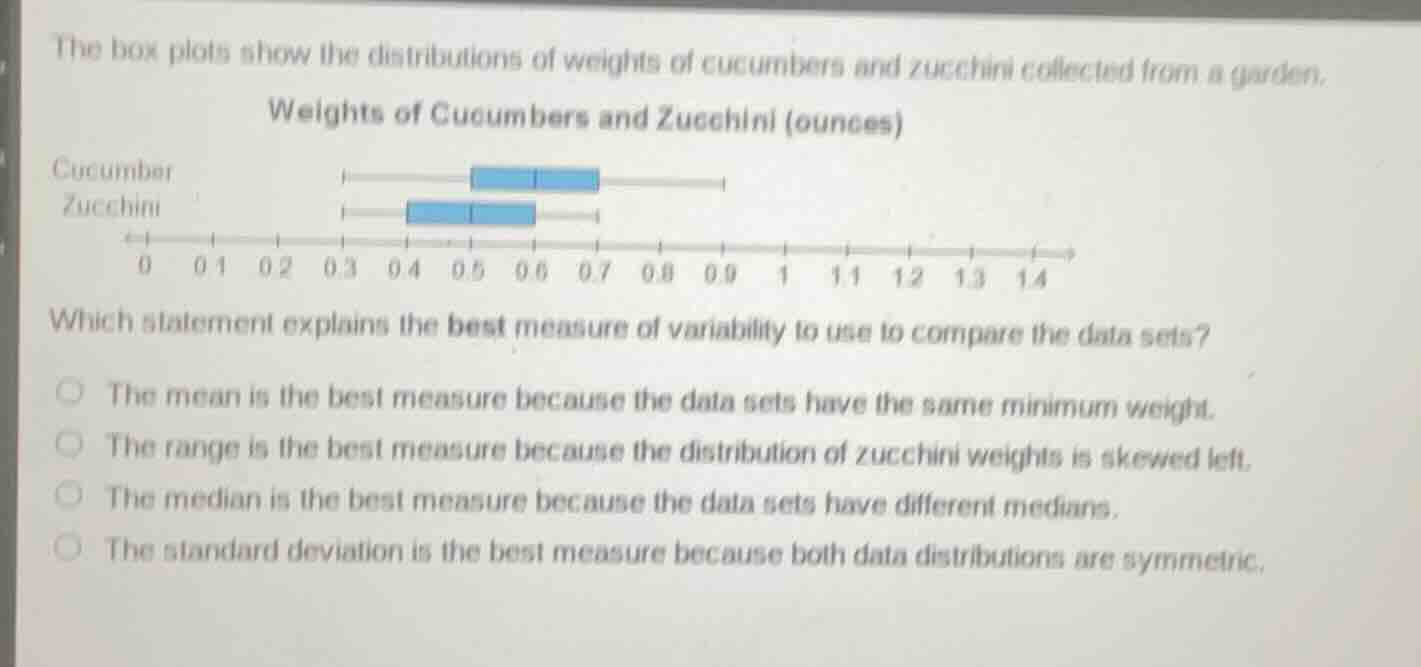
the box plots show the distributions of weights of cucumbers and zucchini collected from a garden.
weights of cucumbers and zucchini (ounces)
cucumber
zucchini
0 0.1 0.2 0.3 0.4 0.5 0.6 0.7 0.8 0.9 1 1.1 1.2 1.3 1.4
which statement explains the best measure of variability to use to compare the data sets?
the mean is the best measure because the data sets have the same minimum weight.
the range is the best measure because the distribution of zucchini weights is skewed left.
the median is the best measure because the data sets have different medians.
the standard deviation is the best measure because both data distributions are symmetric.
First, analyze each option:
- The mean is a measure of central tendency, not variability, so this option is incorrect.
- The zucchini distribution is not skewed left; its box plot shows symmetry, and range is a less robust measure for symmetric data.
- The median is a measure of central tendency, not variability, so this option is incorrect.
- Standard deviation is a measure of variability, and box plots for both data sets appear symmetric (the boxes are centered between whiskers), making standard deviation an appropriate measure for symmetric distributions.

Snap & solve any problem in the app
Get step-by-step solutions on Sovi AI
Photo-based solutions with guided steps
Explore more problems and detailed explanations
The standard deviation is the best measure because both data distributions are symmetric.