QUESTION IMAGE
Question
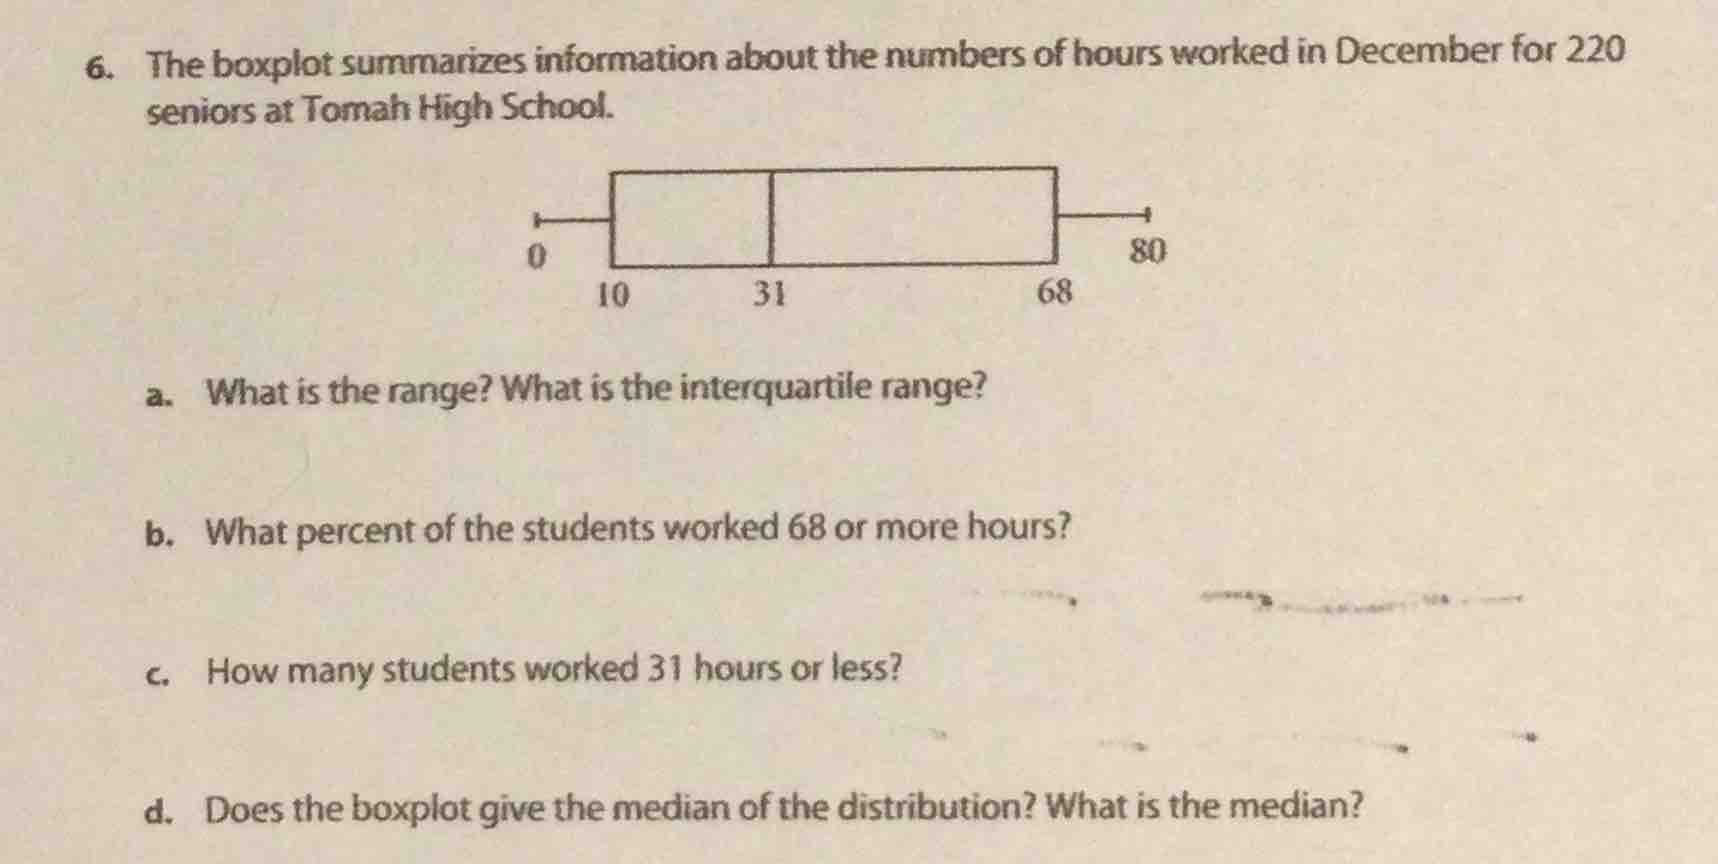
- the boxplot summarizes information about the numbers of hours worked in december for 220 seniors at tomah high school.
a. what is the range? what is the interquartile range?
b. what percent of the students worked 68 or more hours?
c. how many students worked 31 hours or less?
d. does the boxplot give the median of the distribution? what is the median?
Part a
Step1: Calculate Range
Range is maximum minus minimum. From boxplot, max = 80, min = 0.
$Range = 80 - 0$
Step2: Calculate Interquartile Range (IQR)
IQR is $Q_3 - Q_1$. From boxplot, $Q_3 = 68$, $Q_1 = 10$.
$IQR = 68 - 10$
In a boxplot, $Q_3$ (68 here) is the 75th percentile. So data ≥ $Q_3$ is 25% (since 100% - 75% = 25%).
Median (31 here) is the 50th percentile. So 50% of 220 students worked ≤ 31 hours.
$Number\ of\ students = 0.5 \times 220$

Snap & solve any problem in the app
Get step-by-step solutions on Sovi AI
Photo-based solutions with guided steps
Explore more problems and detailed explanations
Range: $80 - 0 = 80$
Interquartile Range: $68 - 10 = 58$